
Veja também


 26.08.2026 06:58 AM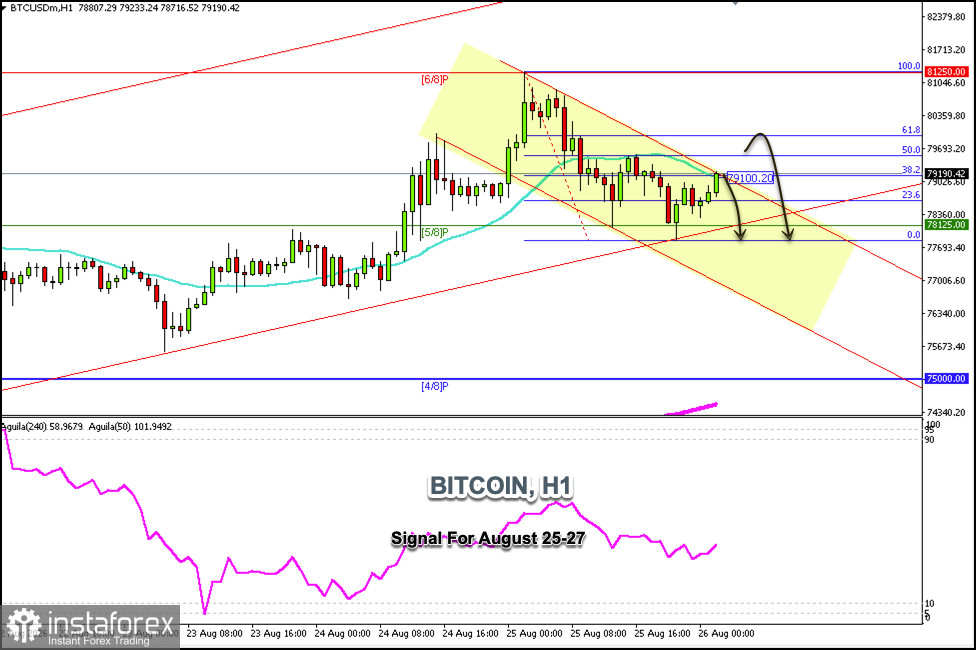
Bitcoin is trading around $79,120 within a downtrend channel formed on the H1 chart since its high of $81,250. Bitcoin could continue its rise in the coming hours until it reaches the 61.8% Fibonacci level around $80,000.
If Bitcoin falls below the 21 SMA—located around the 38.2% Fibonacci level—in the coming hours, we could expect it to resume its downtrend and potentially reach the 5/8 Murray level around $78,125; it could even approach the August 24 low around $76,000.
Conversely, a decisive break above the 21 SMA and above $79,100 will be seen as a buy signal with targets at the psychological level of $80,000; ultimately, we expect it to reach the 6/8 Murray level around $81,250.
The Fibonacci indicator suggests a potential technical rebound to the psychological level of $80,000. Technically, we could wait for this zone to open short positions or expect BTC to encounter strong resistance and, in turn, form a double-top pattern around $81,225—which could also be seen as a clear signal to sell.
A decisive break below the 5/8 Murray level could signal a strong bearish trend, and we expect it to reach the 4/8 Murray level around $75,000 in the short term.
You have already liked this post today
*A análise de mercado aqui postada destina-se a aumentar o seu conhecimento, mas não dar instruções para fazer uma negociação.


