
Veja também


 31.08.2026 09:42 AM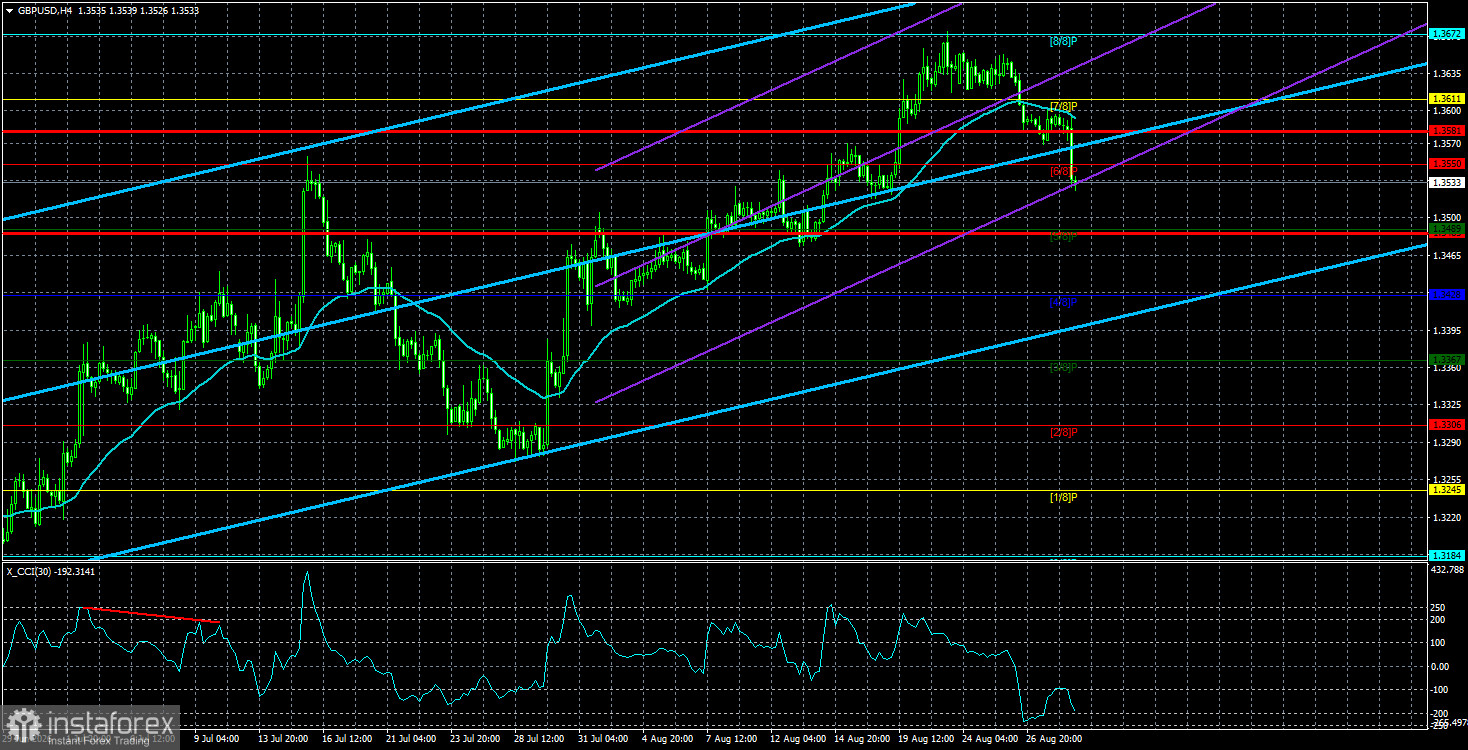
The GBP/USD currency pair showed a fairly strong decline on Friday, but in fact, it turned out to be even weaker than the EUR/USD pair. The day's volatility was only 71 pips, which is generally considered "average" for the British pound, leaning towards "low." Thus, the dollar increased in value – yes. Did it increase significantly? No. The rise was solely based on corrections. In our view, neither Kevin Warsh nor the Nonfarm Payrolls report provided compelling reasons to buy the dollar. The market reacted by buying American currency and had the right to do so, because market reactions depend on the alignment or misalignment of actual results with forecasted events. The market surely expected a much weaker annual value from Nonfarm Payrolls and interpreted Warsh's speech as "hawkish," even though the Federal Reserve chair had already spoken for the third consecutive time about the unacceptability of high inflation and... the Fed is doing absolutely nothing.
Let's break down the annual Nonfarm Payrolls report. Last year, the revision to the annual Nonfarm figure reduced the total number of jobs created by 911,000. The result: the American economy averaged 17-18,000 jobs per month in 2025. It is worth mentioning that this is a minuscule figure. This year, the situation is "much better." The U.S. economy is averaging 50-60,000 jobs per month, which is still very, very low. In the last four months, the Nonfarm Payrolls figure has only been declining, and in July it fell below the "waterline" - the zero mark. In addition, previous months' figures are revised downward each month. As a bonus, the annual Nonfarm Payrolls report further reduced the total job count by another 79,000. Who found anything positive for the dollar in these numbers?
We understand the traders. They clearly expected an even worse result from the annual Nonfarm Payrolls. Hence, the dollar rose because the market anticipated a much more pessimistic outcome. However, just because the market expected an even more negative result does not mean that the actual result was positive. Therefore, yes, the dollar rose on Friday, and this can be explained. However, we cannot say that the dollar's prospects became sharply better after Friday. It's also important to remember that the U.S. labor market directly influences the Fed's monetary policy. Kevin Warsh indicated at the Jackson Hole symposium the need to combat high inflation. But he did not specify what methods and ways the Fed intends to use to combat high inflation. And, by the way, we want to point out that "we need to fight" does not always mean "we will fight."
Thus, in our view, the prospects for the American currency remain negative. Corrections are welcome. The daily timeframe clearly shows that the pair has every reason to pull back a bit downward. But on what basis can the dollar grow further? Based on tightening monetary policy by the Fed, which the market has already worked through back in June and which is uncertain to happen anytime soon?
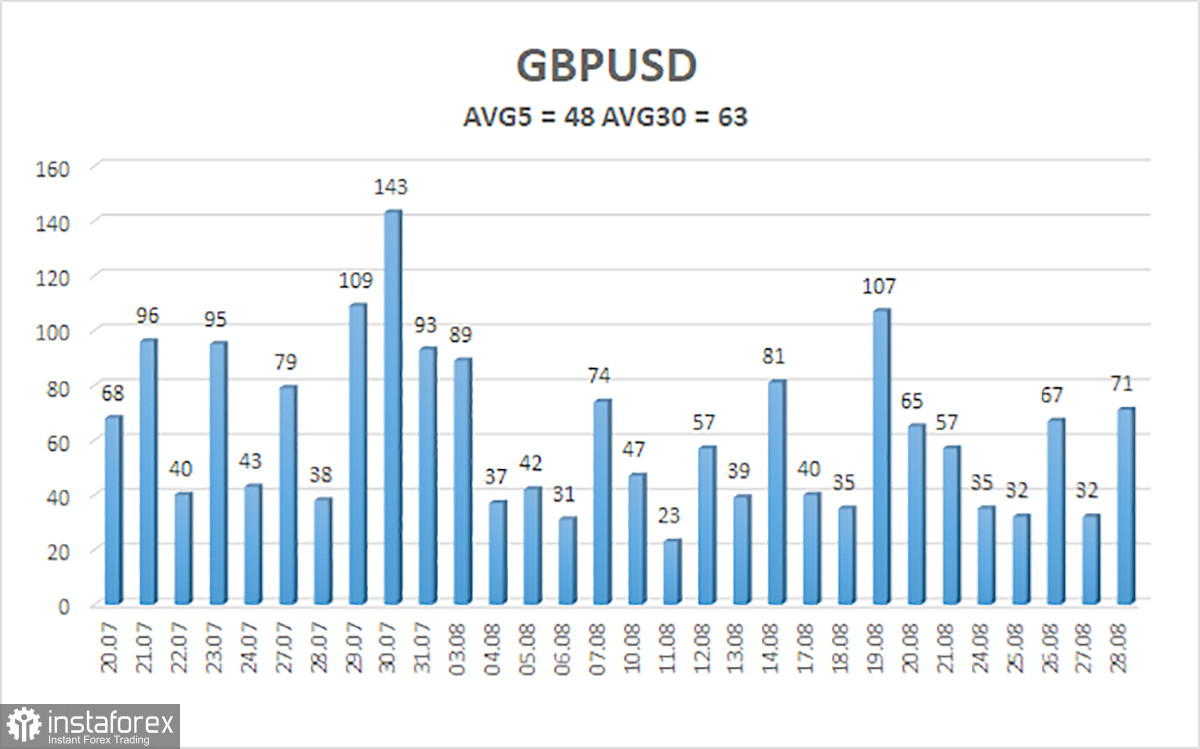
The average volatility of the GBP/USD pair over the last 5 trading days stands at 48 pips. For the pound/dollar pair, this figure is considered "low." On Monday, August 31, we thus expect movement within a range bounded by 1.3485 and 1.3581. The upper channel of the linear regression has turned upward, indicating an upward trend. The CCI indicator has entered oversold territory, signaling a possible completion of the correction.
S1 – 1.3489
S2 – 1.3428
S3 – 1.3367
R1 – 1.3550
R2 – 1.3611
R3 – 1.3672
The GBP/USD currency pair maintains an upward trend. Trump's policies will continue to exert pressure on the U.S. economy, so we do not expect long-term growth in the U.S. dollar. The year 2026 is currently looking very positive for the dollar due to geopolitics, but every fairy tale comes to an end. On the weekly timeframe, price remains flat between 1.3150 and 1.3780 within a four-year upward trend, supporting expectations of continued growth in the British currency in the medium term. Long positions with targets of 1.3672 and 1.3733 can be considered when the price is above the moving average. If the price is below the moving average line, trading can be conducted for a decline with targets of 1.3489 and 1.3428.
Regression channels help determine the current trend. If both are directed in the same direction, it means the trend is currently strong;
The moving average line (settings 20,0, smoothed) defines the short-term trend and the direction in which trading should be conducted at present;
Murray levels are target levels for moves and corrections;
Volatility levels (red lines) are the probable price channel within which the pair will spend the next 24 hours based on current volatility indicators;
The CCI indicator – its entry into the oversold area (below -250) or the overbought area (above +250) indicates that a trend reversal in the opposite direction is approaching.


