Vea también

 21.11.2023 08:13 AM
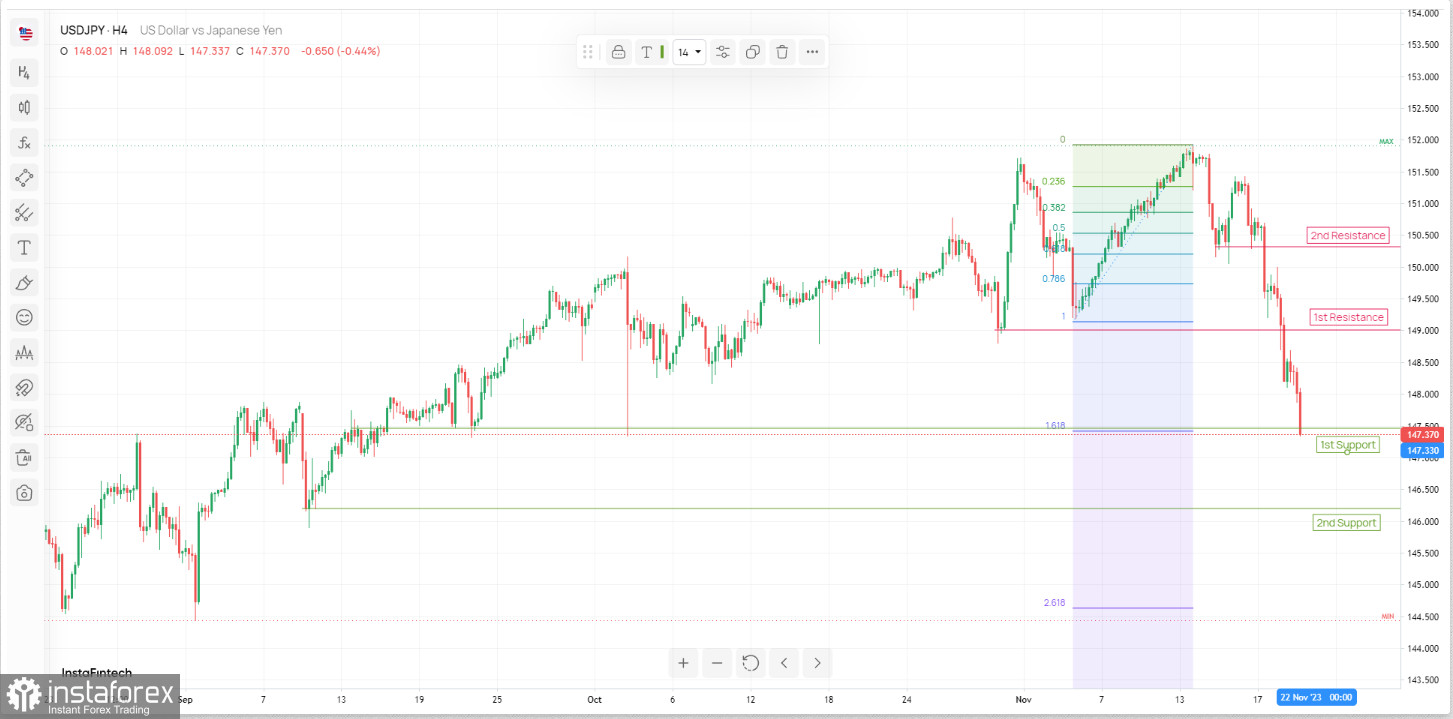
The USD/JPY chart currently exhibits a bearish momentum, with a potential for price to make a bearish breakout below the 1st support and drop towards the 2nd support.
The 1st support level (147.46) is identified as an overlap support that aligns with the 161.80% Fibonacci extension level while the 2nd support level (146.20) is noted as a pullback support. These support levels represent areas where buyers may potentially step in to halt the bearish movement.
Conversely, the 1st and 2nd resistances are both pullback resistances (149.00 and 150.32 respectively), potentially acting as barriers to upward movement.
In summary, USD/JPY has a bearish outlook with the potential to break below the 1st support.
You have already liked this post today
*El análisis de mercado publicado aquí tiene la finalidad de incrementar su conocimiento, más no darle instrucciones para realizar una operación.


