Xem thêm

 27.03.2023 07:49 AM
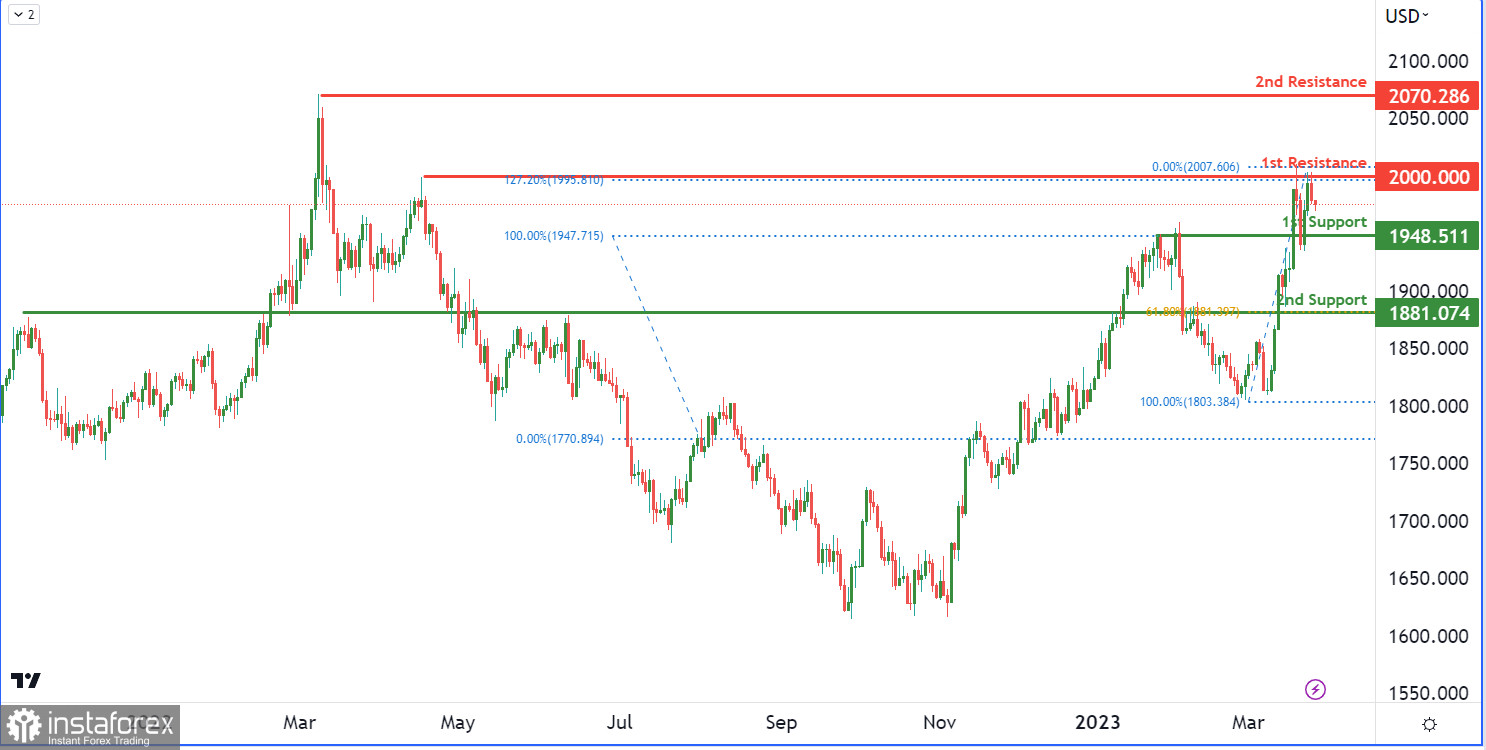
The XAU/USD chart currently has bearish momentum, with potential for a drop towards the first support level at 1948, an overlap support level. If prices continue to fall, they could test the second support level at 1881, another overlap support level and the 61.80% Fibonacci retracement level. The recent bearish momentum adds to the likelihood of further declines towards the first support level.
You have already liked this post today
*Phân tích thị trường được đăng tải ở đây có nghĩa là để gia tăng nhận thức của bạn, nhưng không đưa ra các chỉ dẫn để thực hiện một giao dịch.

