Vea también

 27.03.2023 07:49 AM
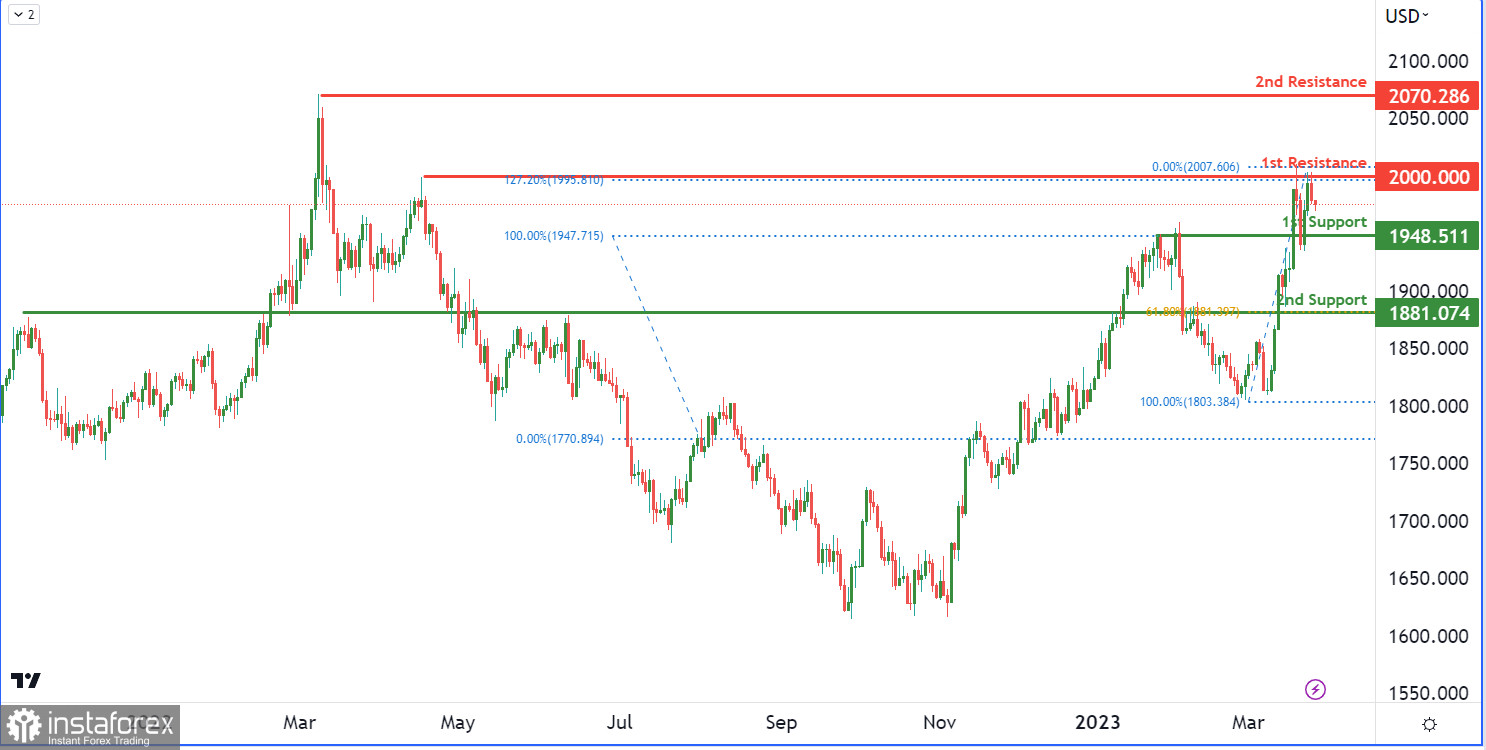
The XAU/USD chart currently has bearish momentum, with potential for a drop towards the first support level at 1948, an overlap support level. If prices continue to fall, they could test the second support level at 1881, another overlap support level and the 61.80% Fibonacci retracement level. The recent bearish momentum adds to the likelihood of further declines towards the first support level.
You have already liked this post today
*El análisis de mercado publicado aquí tiene la finalidad de incrementar su conocimiento, más no darle instrucciones para realizar una operación.


