Lihat juga

 12.03.2026 12:47 AM
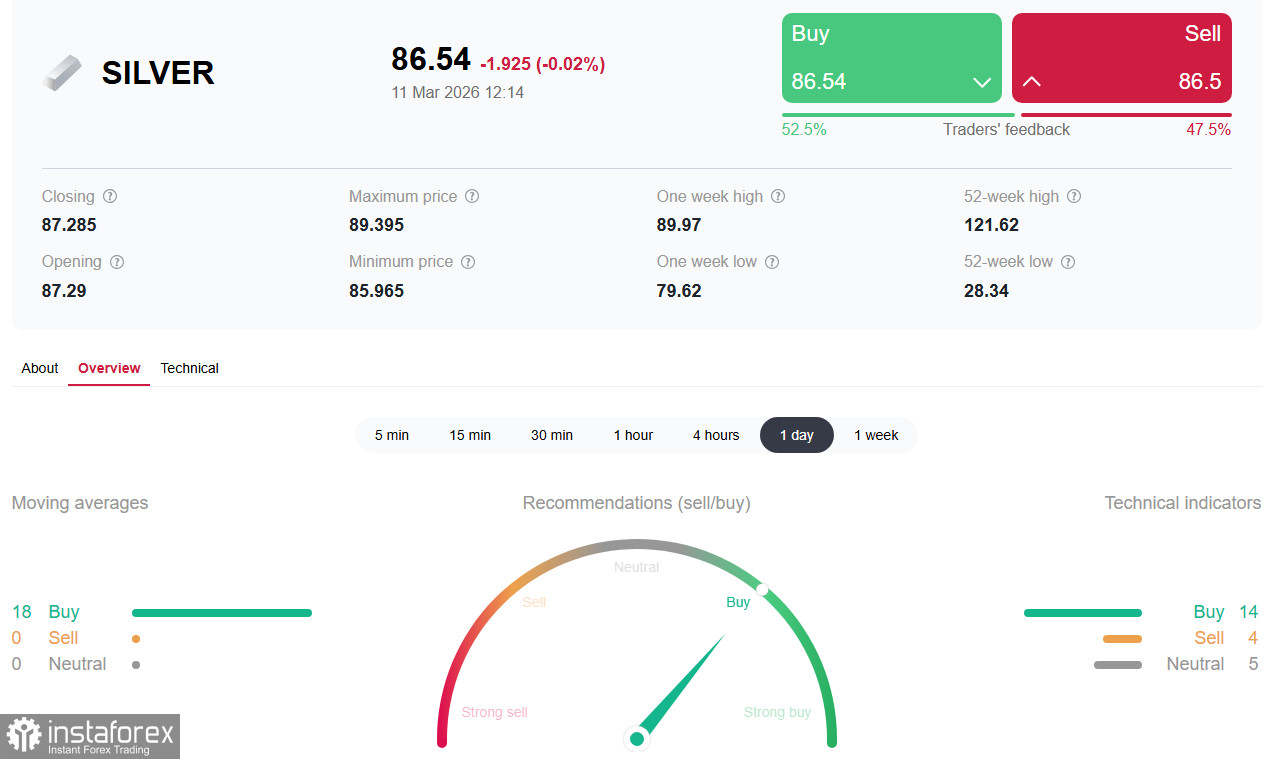
*see also: Trading indicators for SILVER (XAG/USD)
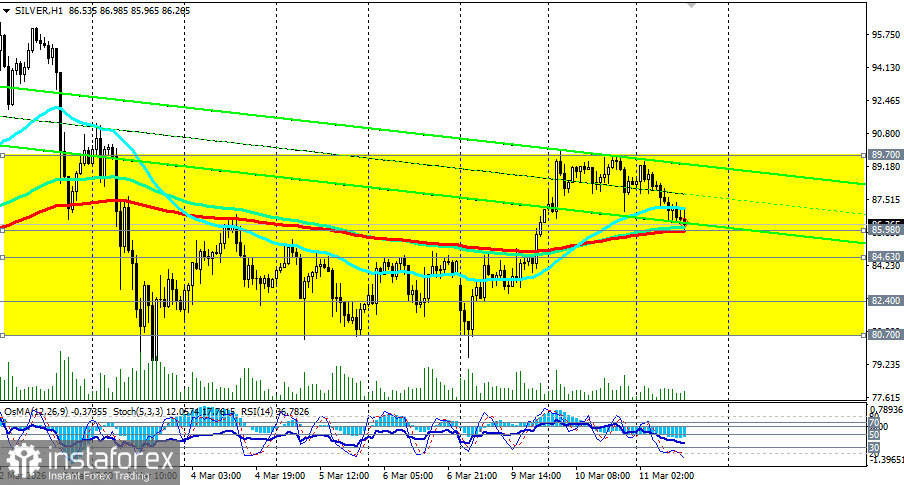
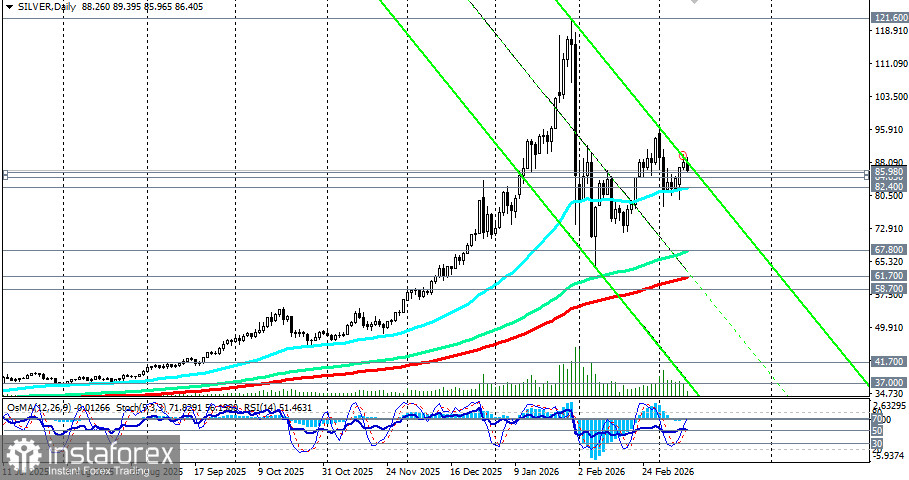
The silver market is experiencing one of the most dramatic periods in modern history. The price of the metal has risen by 161% year-on-year, reaching a historic high near $121.60 per ounce in January, followed by a brutal correction to $71.25 in January and $64.10 in February, before recovering to $95.00-96.00 in early March. Currently, silver (XAG/USD) is trading near the $86.30 mark, declining towards a key short-term support level of $85.98 (200 EMA on the 1-hour price chart) and consolidating after four days of gains. Meanwhile, market participants are questioning whether the pricing mechanism for paper silver is broken or if we are witnessing extraordinary but temporary compression.
The immediate catalyst for the current recovery remains the escalation of the conflict between the U.S., Israel, and Iran. Military actions have entered their second week, with intense airstrikes and retaliatory missile attacks. The potential blockage of the Strait of Hormuz, which carries about 20% of the world's oil traffic, creates the threat of a global energy crisis. President Trump has stated that the war may end "very soon" and announced that U.S. tankers will be escorted through the strait to protect shipping routes. However, U.S. officials have indicated that military operations are intensifying, and the prospects for diplomatic negotiations are limited. The Islamic Revolutionary Guard Corps (IRGC) warned that the blockade will continue until the attacks cease.
Each new escalation creates fresh demand for "safe havens" in precious metals. Gold has already risen above $5,400 per ounce—more than 100% year-on-year—and silver, which historically follows gold in both directions, is tracking it.
A deep structural story is unfolding in COMEX inventories. In just seven days, 33.45 million ounces of silver were physically withdrawn for delivery in January—about 26% of all registered COMEX inventories disappeared in one week. By the end of February, registered silver inventories had fallen to around 86.1 million ounces—a decrease of 31% compared to levels a few months earlier.
The March 2026 delivery cycle is described as a "stress test" for the entire global silver pricing system, with demand for delivery representing over 60% of total registered stocks—leaving almost no margin for error. CME's response—a margin requirement increase from 15% to 18% in mid-February—provoked a sharp one-day drop of 10%, marking the third-largest decline in silver since 2020. While the margin increase worked to control leverage in the short term, it does not resolve the issue of physical shortages.
"This system hasn't collapsed yet due to one simple assumption: no one will demand delivery all at once. In early 2026, that assumption failed," say experts in the precious metals market.
One of the most significant technical events in the silver market is the divergence between Eastern and Western pricing. Silver is trading higher in Shanghai, while the Western COMEX price lags. This gap is due to physical demand disrupting the paper market and the unyielding industrial demand from Chinese manufacturers.
Previous expert analyses of silver's rise noted that gold did not follow silver when the movement implied an industrial rather than purely defensive nature. Silver's dual role—as both a monetary metal and an industrial raw material—means it is subject to demand pressures not faced by gold. Data from the Silver Institute shows an annual supply deficit of 110-300 million ounces—a structural imbalance underlying every long-term price forecast.
Rising oil prices due to the blockage of the Strait of Hormuz fuel global inflation concerns. Prices surged above $110.00 per barrel on Monday but corrected after reports that the IEA is considering the largest emergency release of oil in history to stabilize the markets. The proposed volume will exceed 182 million barrels, released in 2022 after the start of the military operation in Ukraine.
This improved market sentiment and led to optimism that the conflict might have less impact on inflation than initially feared. However, the risk remains: Qatar's energy minister warned that a halt in exports from the Persian Gulf could raise oil prices to $150.00 per barrel.
The U.S. Consumer Price Index (CPI) data for February will be a key test. The overall CPI is expected to remain at 2.4% year-on-year, while the core CPI is expected to remain at 2.5%. However, the February data will not reflect the impact of rising oil prices triggered by the escalation of the conflict on February 28, meaning market reactions could be muted.
As a non-yielding asset, silver tends to rise when interest rates fall. However, the surge in energy prices has reignited inflationary concerns, which may compel the Fed to maintain a rigid policy for longer, exerting pressure on the metal. Markets are currently pricing in the next rate cut only for September, whereas prior to the escalation of the conflict, expectations were for July.
The key zone of 86.00-89.70 (the upper boundary of the range 80.70-89.70) will remain crucial. Holding above this level will open the path for testing $90.00 and further toward $94.00, while breaking below 86.00 will direct the price to $84.00, $82.40 (50 EMA on the daily chart), and to $81.00-80.70.
Silver is experiencing a historical moment in which short-term volatility driven by the Middle Eastern crisis overlaps with a structural deficit in physical metal and rising industrial demand. The key zone of 86.00-89.70 will be decisive for bulls in the coming days—a breakout above this level opens the door for a retest of historical highs at 118.00-121.00, while a break below 82.40-80.70 could deepen the correction to 70.00-67.80 (144 EMA on the daily chart).
Investors should closely monitor the development of diplomatic contacts, U.S. inflation data, and, most importantly, the dynamics of physical stocks on COMEX. Success will favor those who can separate short-term noise from long-term trends—structural factors (deficits, industrial demand, inventory depletion) continue to indicate growth potential toward $120.00 and above in the second half of the year, as forecasted by some of the largest banks and independent experts in the precious metals market.


