
Lihat juga


 26.05.2026 11:38 AM
On Monday, the EUR/USD pair consolidated above the 50.0% Fibonacci corrective level at 1.1630, allowing traders to expect continued growth toward the next Fibonacci level of 38.2% at 1.1682. A close below the 1.1630 level would favor the U.S. dollar and resume the decline toward the 61.8% corrective level at 1.1578. Trader activity has been very weak in recent days.
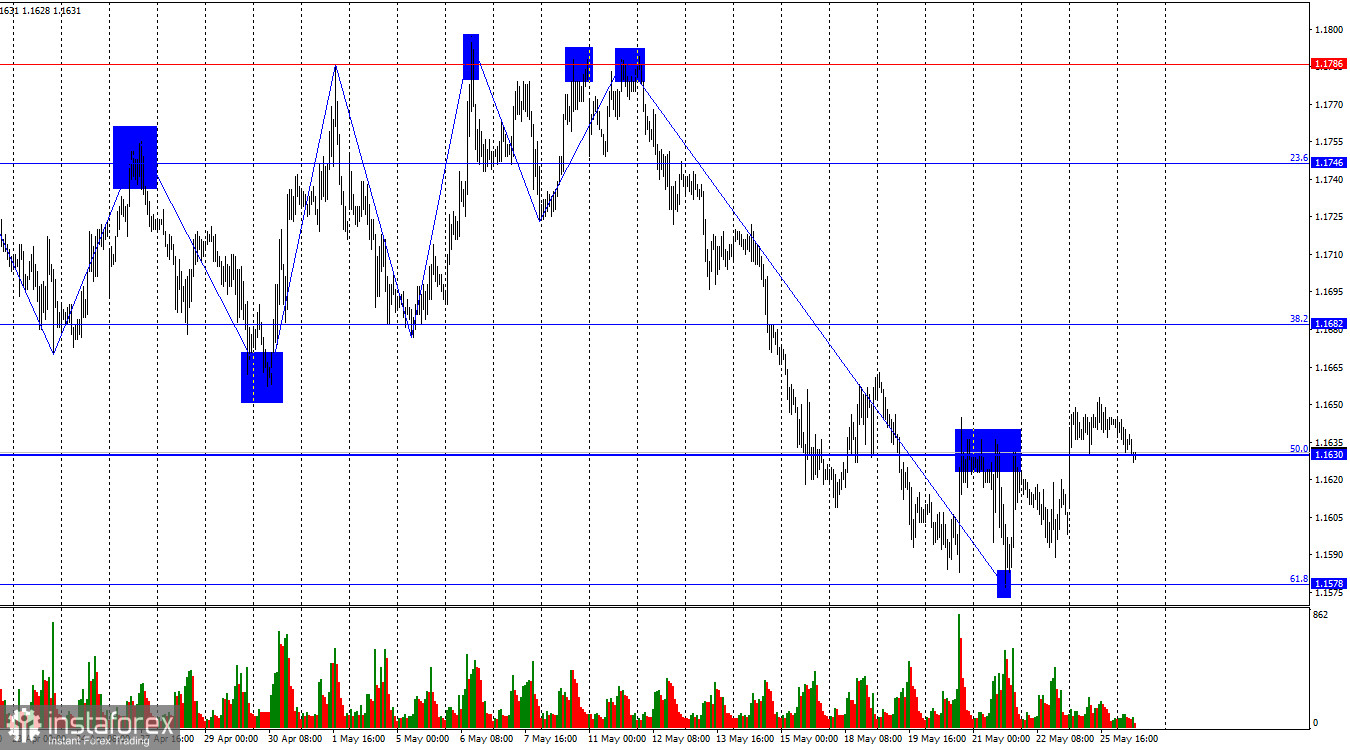
The wave structure on the hourly chart currently remains straightforward. The latest completed upward wave failed to break the previous high, while the latest downward wave confidently broke the previous low. Thus, the trend has shifted to "bearish." The temporary ceasefire between Iran and the United States supported the bulls for an entire month, but this was followed by a collapse in hopes for lasting peace. Bulls will only be able to launch a meaningful advance if Iran and the U.S. sign an interim agreement.
There were very few noteworthy global events on Monday, and no economic news at all. Donald Trump once again reported successful negotiations with Iran, which could allow the Strait of Hormuz to reopen in the near future. However, Trump's rhetoric regarding Iran has changed sharply recently. The U.S. leader stated that Iran would either remove all enriched uranium from the country or destroy it completely. At the same time, Trump now says he does not want to rush into signing an agreement "to avoid mistakes." According to the U.S. president, time is working in America's favor, not against it.
The reason behind this sharp shift remains unclear, especially since Trump had previously repeatedly urged Iran to sign an agreement as soon as possible. Now it appears that no one is in a hurry, while no news is coming from Iran at all. Traders still do not understand whether Iran has agreed to an interim deal, whether it is willing to surrender all enriched uranium, or whether it is prepared to reopen the Strait of Hormuz. As a result, the market remains in limbo and is reluctant to commit to either buying or selling.
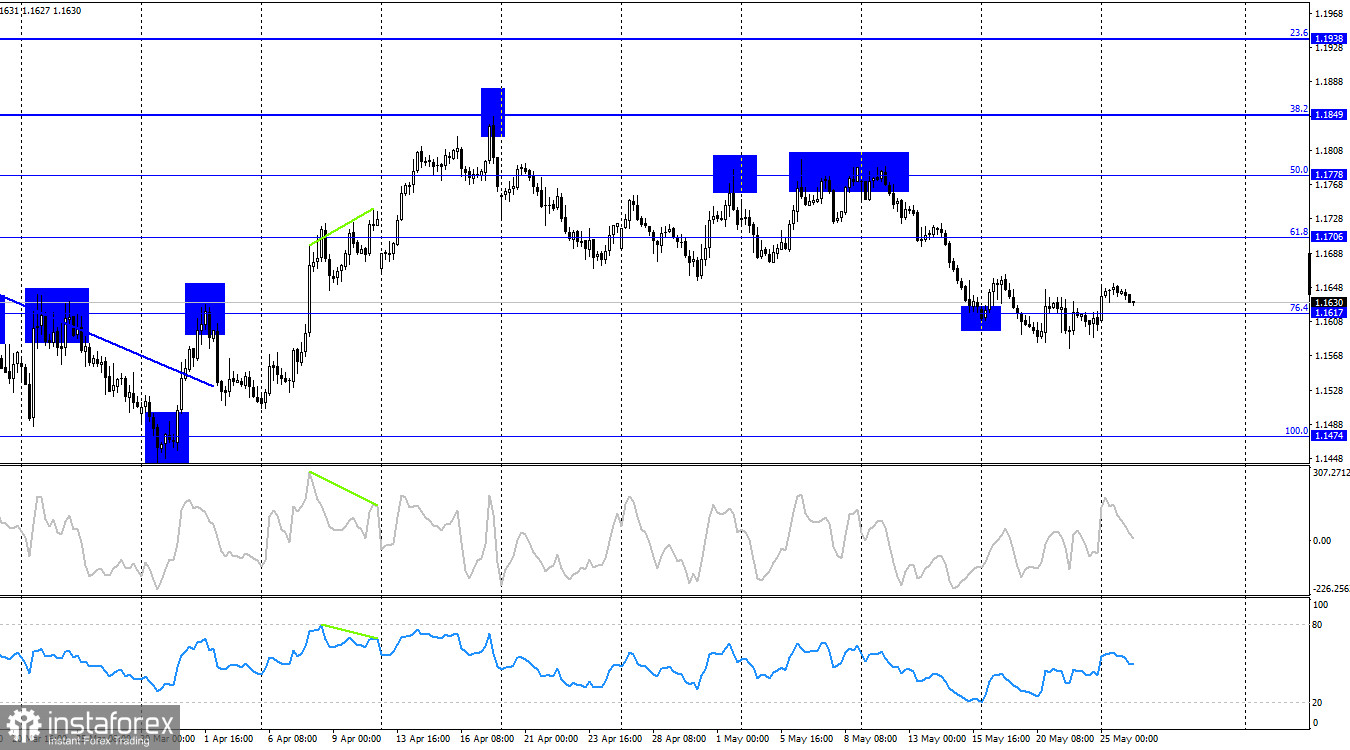
On the 4-hour chart, the pair rebounded from the 76.4% corrective level at 1.1617 but failed to either continue rising or begin a decline. As a result, the market is in no hurry to open positions or draw conclusions. At the moment, I recommend focusing more on the hourly chart, as price movements remain fairly weak. No emerging divergences are currently visible on any indicators.
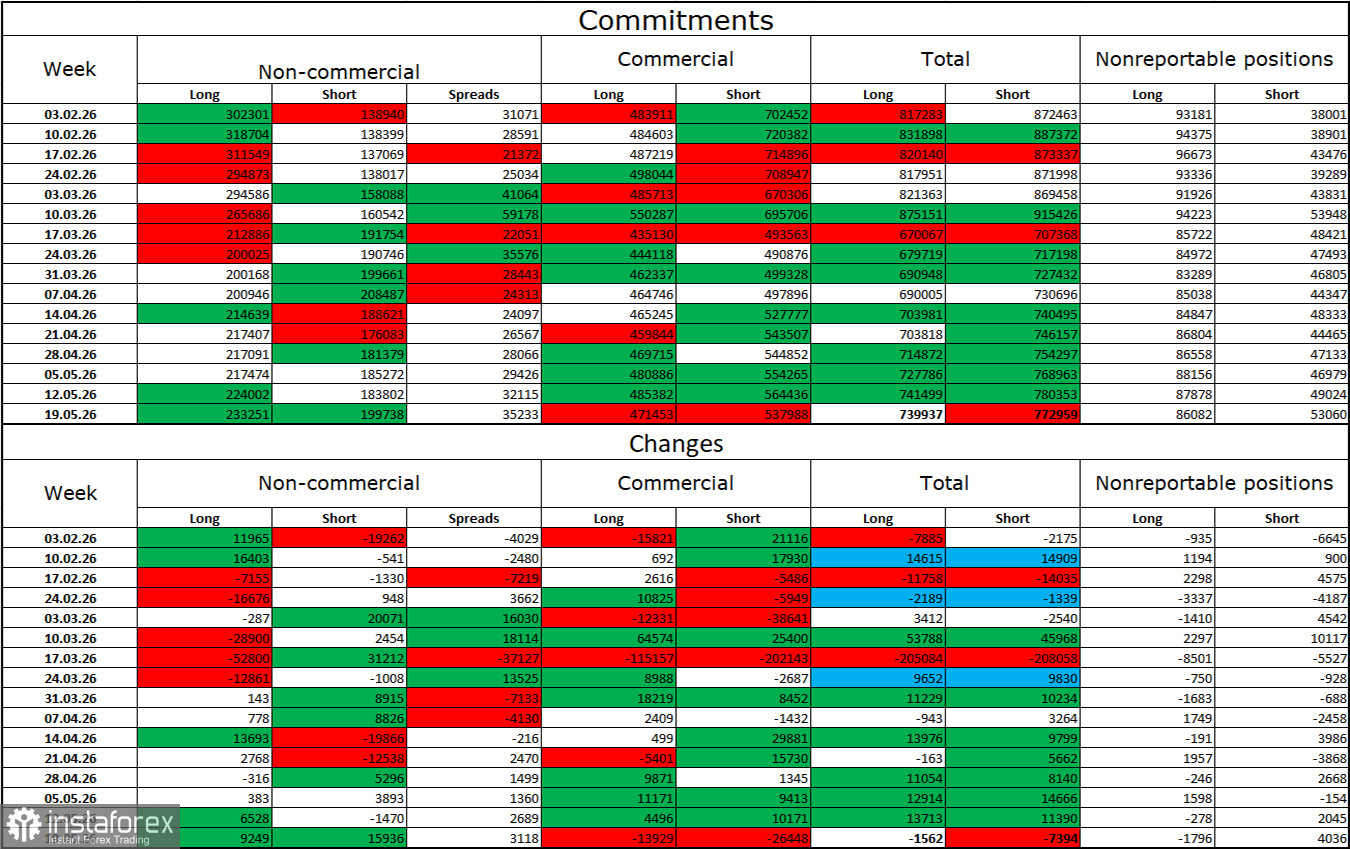
During the latest reporting week, professional traders opened 9,249 long positions and 15,936 short positions. Over the seven weeks in February and March, the bulls' overwhelming advantage disappeared due to the war in Iran, while over the past eight weeks the situation has stabilized amid the suspension of hostilities in the Middle East. The total number of long positions held by speculators now stands at 233,000, compared to 199,000 short positions. The gap is once again widening in favor of the euro.
Overall, in the long term, major market participants continue to show strong interest in the euro. Naturally, global events of various kinds — which have been abundant in recent years — continue to influence investor sentiment. At present, the market's focus remains firmly on the Middle East, where the war has merely been paused rather than ended. Therefore, in the near future, the euro and dollar exchange rates will depend less on Federal Reserve or ECB monetary policy and economic data, and more on developments in Iran.
The economic calendar for May 26 contains no notable events. Therefore, the influence of economic data on market sentiment on Tuesday will be absent.
I would recommend selling the pair today if it closes below the 1.1630 level on the hourly chart, with a target at 1.1578. Buy positions could have been opened after a close above the 1.1630 level, with targets at 1.1682 and 1.1745. These trades may still be kept open today.
Fibonacci levels are drawn from 1.1409–1.1850 on the hourly chart and from 1.1474–1.2082 on the 4-hour chart.


