আরও দেখুন

 23.03.2023 07:55 AM
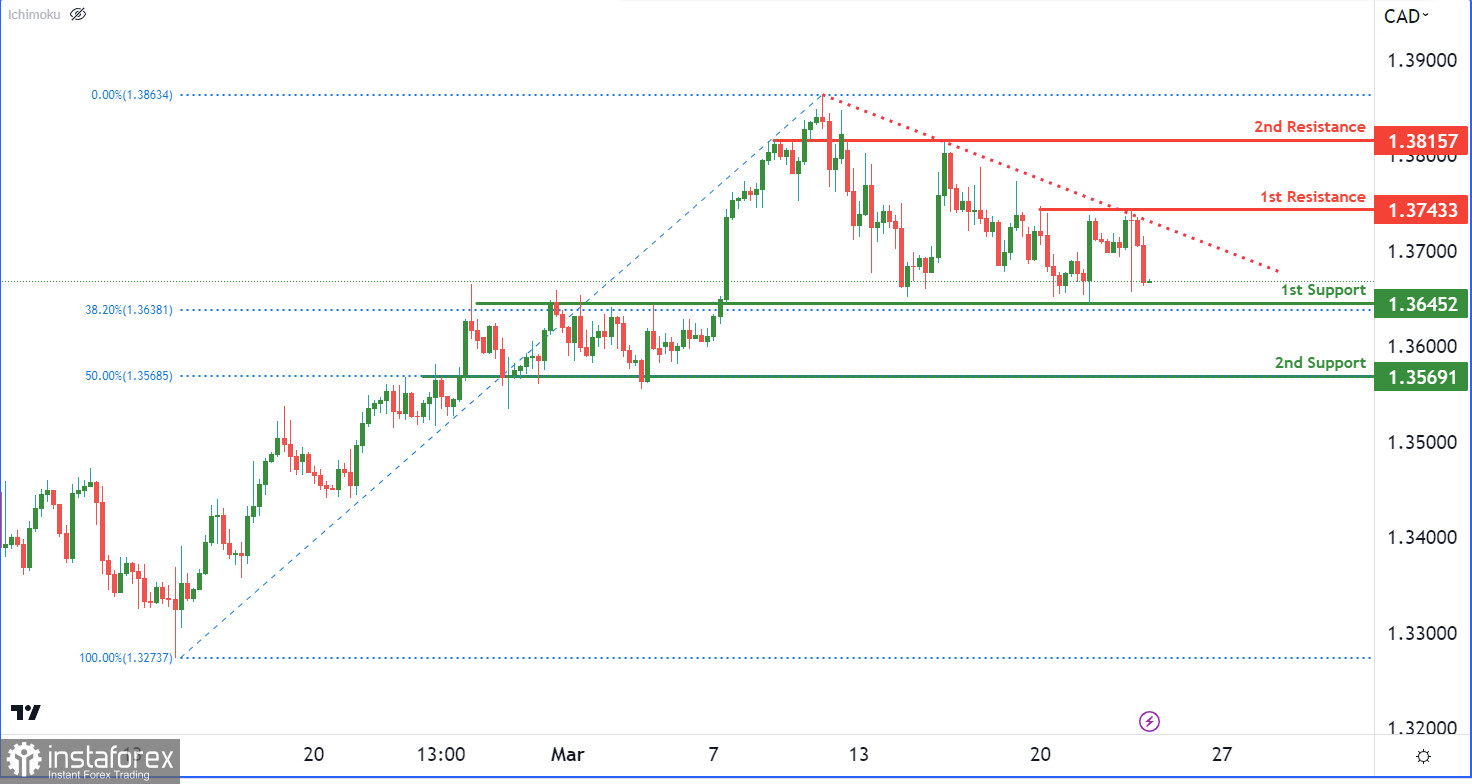
The charts indicate that the USD/CAD currency pair is currently experiencing a bearish momentum, with price situated below a significant descending trend line. As such, it is likely that the bearish trend will continue. In the event of a drop in price, there are two potential support levels that may come into play. The first support level, at 1.3645, is a strong overlap support level and coincides with the 38.20% Fibonacci retracement level. The second support level, at 1.3569, is also an overlap support and located at the 50% Fibonacci retracement level.
Alternatively, there are two potential resistance levels that price may encounter if it rises. The first, at 1.3743, is a multi-swing high resistance level. The second resistance level, at 1.3815, is an overlap resistance level.
You have already liked this post today
*এখানে পোস্ট করা মার্কেট বিশ্লেষণ আপনার সচেতনতা বৃদ্ধির জন্য প্রদান করা হয়, ট্রেড করার নির্দেশনা প্রদানের জন্য প্রদান করা হয় না।


