আরও দেখুন

 05.12.2025 04:17 AM
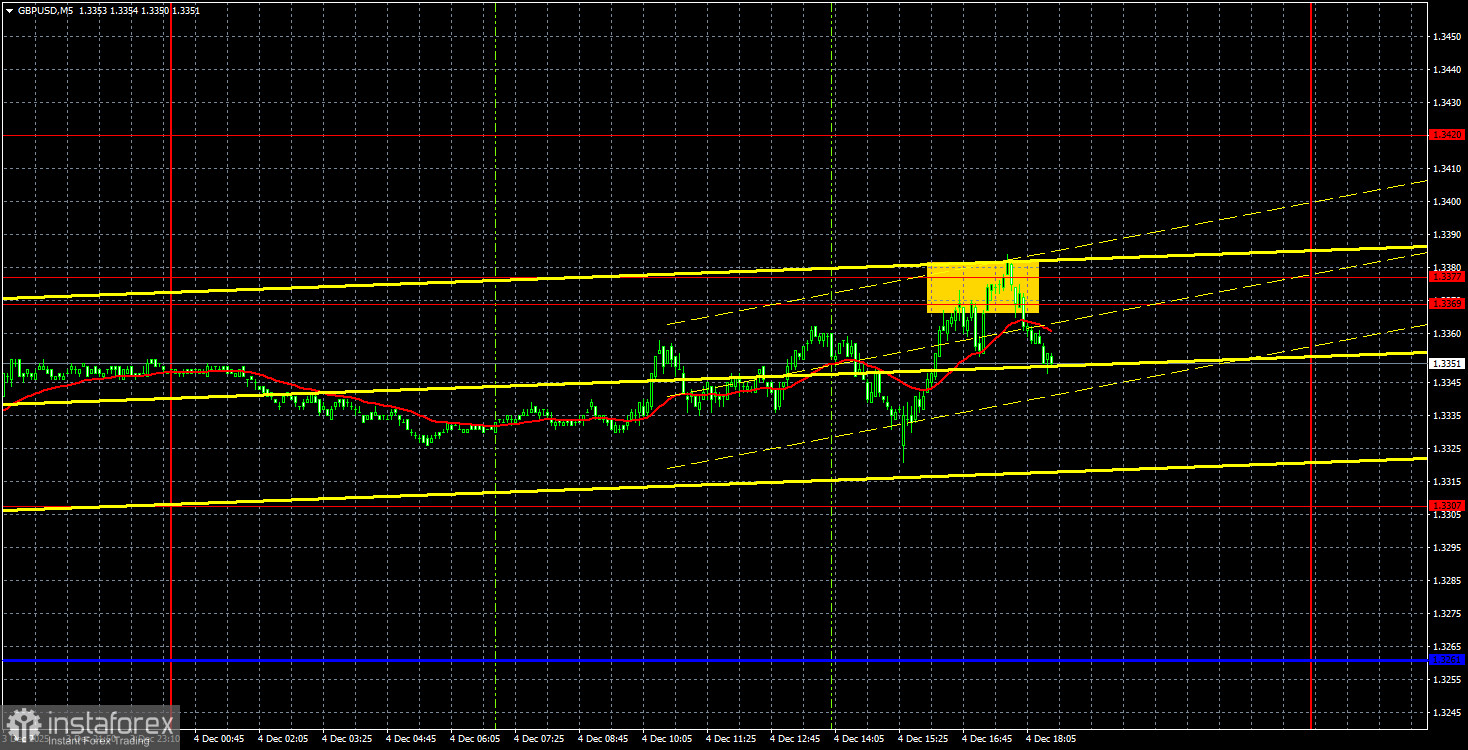
The GBP/USD pair made a final push towards the nearest target area of 1.3369-1.3377 on Thursday. It was unable to break through this area on the first attempt, which is not surprising given that this is a resistance zone. Moreover, the British pound has already risen considerably this week, and we have no objections to it. Notably, this rise occurred before the release of the crucial ADP report in the U.S., but this does not change the essence of the situation. The key takeaway is that the British pound is indeed rising, which we anticipated. The upward trend remains relevant, as indicated by the trend line. In the medium term, we continue to expect the British pound to grow. However, today the pair may experience a slight correction, as "not every day is a holiday."
The macroeconomic backdrop was virtually absent yesterday. Only a lone report on jobless claims was published in the U.S., which turned out significantly better than expected. However, one weekly report on jobless claims cannot overshadow the monthly ADP report. The U.S. labor market remains in a dire state, and current data is generally lacking. Consequently, we should expect another easing of monetary policy from the Fed next week, but all the missing reports will soon emerge, allowing for a more balanced decision on rates in early next year.
On the 5-minute timeframe, the pair formed one trading signal yesterday with considerable difficulty. During the American trading session, the price bounced from the 1.3369-1.3377 range, allowing traders to open short positions. This trade likely yielded only a modest profit, but a few dozen pips were achievable.
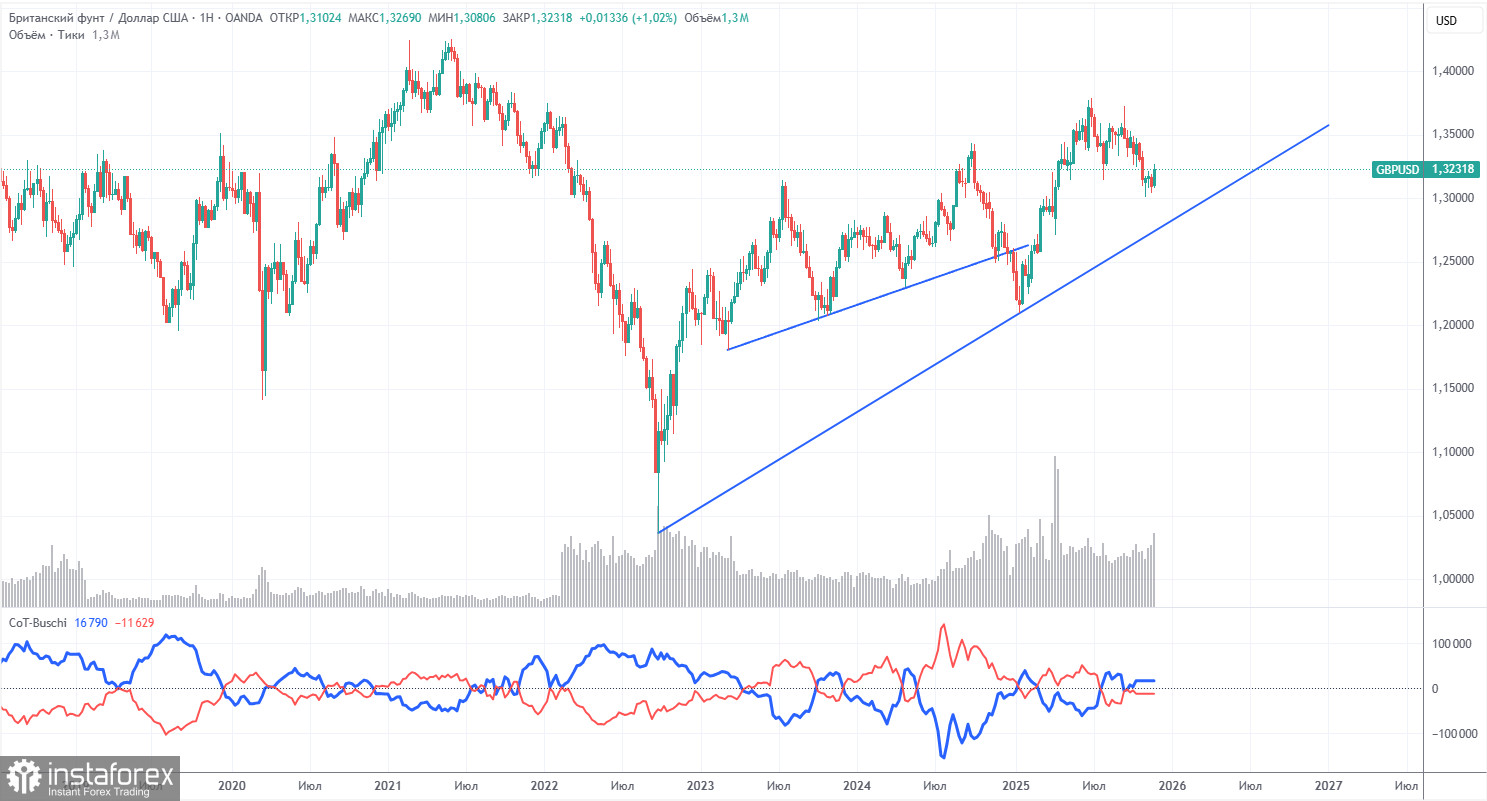
COT reports on the British pound indicate that, in recent years, commercial traders' sentiment has been consistently changing. The red and blue lines displaying the net positions of commercial and non-commercial traders have been crossing frequently, often staying near the zero mark. Currently, they are at nearly the same level, which indicates a roughly equal number of long and short positions.
The dollar continues to weaken due to Donald Trump's policies, as clearly seen on the weekly timeframe. The trade war is likely to continue in one form or another for a long time. The Federal Reserve is set to lower rates in the next 12 months. Demand for the dollar will decline one way or another. According to the last COT report (as of October 14) regarding the British pound, the "Non-commercial" group closed 14,900 long contracts and 7,700 short contracts. Consequently, the net position of non-commercial traders decreased by 7,200 contracts over the week. However, this data is already outdated, and no fresh information is available.
In 2025, the pound significantly increased, but it should be understood that the reason is single – Donald Trump's policies. Once this reason is neutralized, the dollar may strengthen, but when that will happen remains uncertain. Regardless of how fast the net position of the pound rises or falls, the dollar's net position is decreasing, and usually at a faster pace.
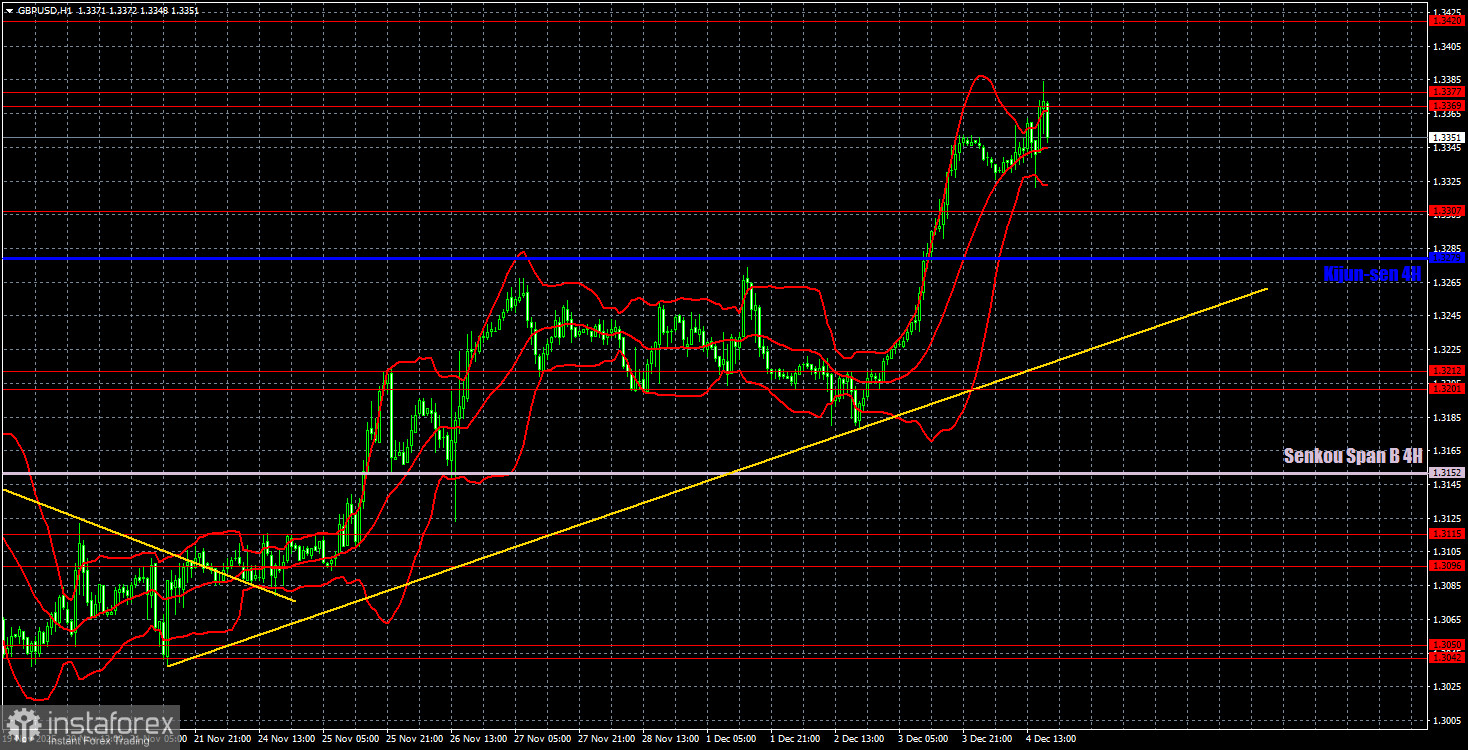
On the hourly timeframe, the GBP/USD pair continues to form an upward trend. We believe that medium-term growth will persist regardless of the local macroeconomic backdrop and that the correction on the daily timeframe will eventually end. Or may already have finished. The British pound finally showed the movement we were waiting for. It would be a mistake not to continue this trend.
For December 5, we highlight the following important levels: 1.2863, 1.2981-1.2987, 1.3042-1.3050, 1.3096-1.3115, 1.3201-1.3212, 1.3307, 1.3369-1.3377, 1.3420, 1.3533-1.3548, and 1.3584. The Senkou Span B (1.3152) and Kijun-sen (1.3279) lines may also serve as signal sources. It is recommended to set the Stop Loss order to breakeven when the price moves in the right direction by 20 pips. The Ichimoku indicator lines may shift throughout the day, which should be taken into account when determining trading signals.
On Friday, no important events or reports are scheduled in the UK, while in the U.S., reports on consumer sentiment, personal income and spending, and the core PCE price index will be released. We do not consider these data to be super important, but they may provoke a market reaction.
Today, traders may consider selling, as the price has bounced from the 1.3369-1.3377 area, with a target at 1.3307. Long positions will become relevant on a rebound from the level of 1.3307 with targets at 1.3369-1.3377 or on a consolidation above the area of 1.3369-1.3377 with a target of 1.3420.


