আরও দেখুন

 12.12.2025 04:08 AM
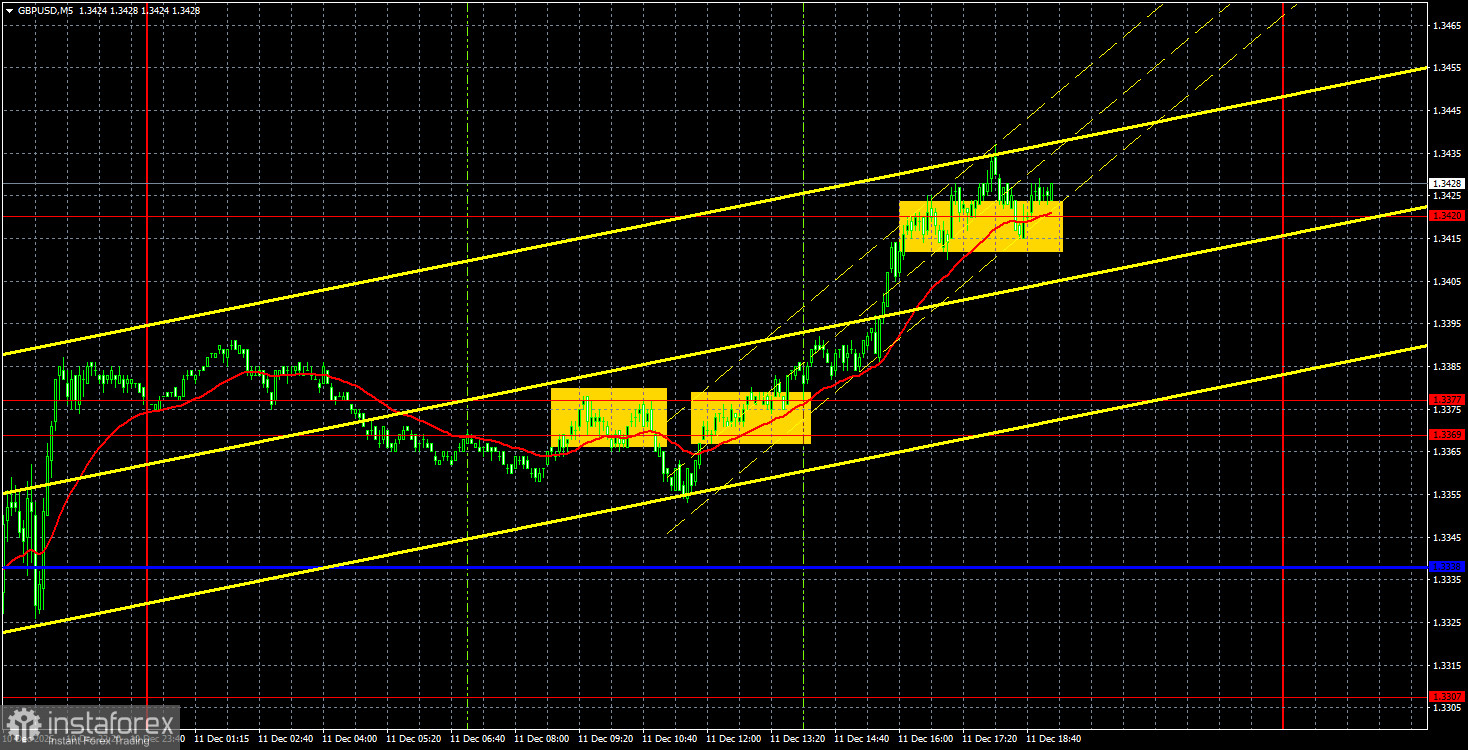
The GBP/USD currency pair continued its upward movement initiated a few weeks ago on Wednesday and Thursday. We do not associate the new rise of the British currency with the Federal Reserve's meeting, as we believe its results are not definitively "dovish." Yes, the rate was lowered for the third consecutive time, but traders were aware of this a month ago and were openly expecting this decision. For 2026, Jerome Powell announced a pause, and the FOMC committee indicated a maximum of one easing of monetary policy. It is probably unnecessary to say that this is not the most "dovish" outcome of a meeting possible. Thus, this time, the U.S. dollar could have shown growth. However, formally, the results of the meeting can be considered "dovish."
We believe the key reasons for the decline of the American currency are its overall overbought condition in recent months, an excessively strong correction against the British pound, and the global fundamental background, which has not changed at all over the past six months. Thus, the dollar was expected to fall in the first half of the year and to continue falling in the second. Of course, we understand that corrections are also necessary, but the pound has lost too much in the last correction, while the dollar has appreciated too much.
On the 5-minute timeframe, three trading signals were formed on Thursday. During the European trading session, the pair bounced off the area of 1.3369-1.3377 but only declined 10 pips. This signal turned out to be false. Then, a buy signal emerged in the same area, allowing a gain of about 40 pips. The level of 1.3420 halted the pair's upward movement, but it seems only temporarily.
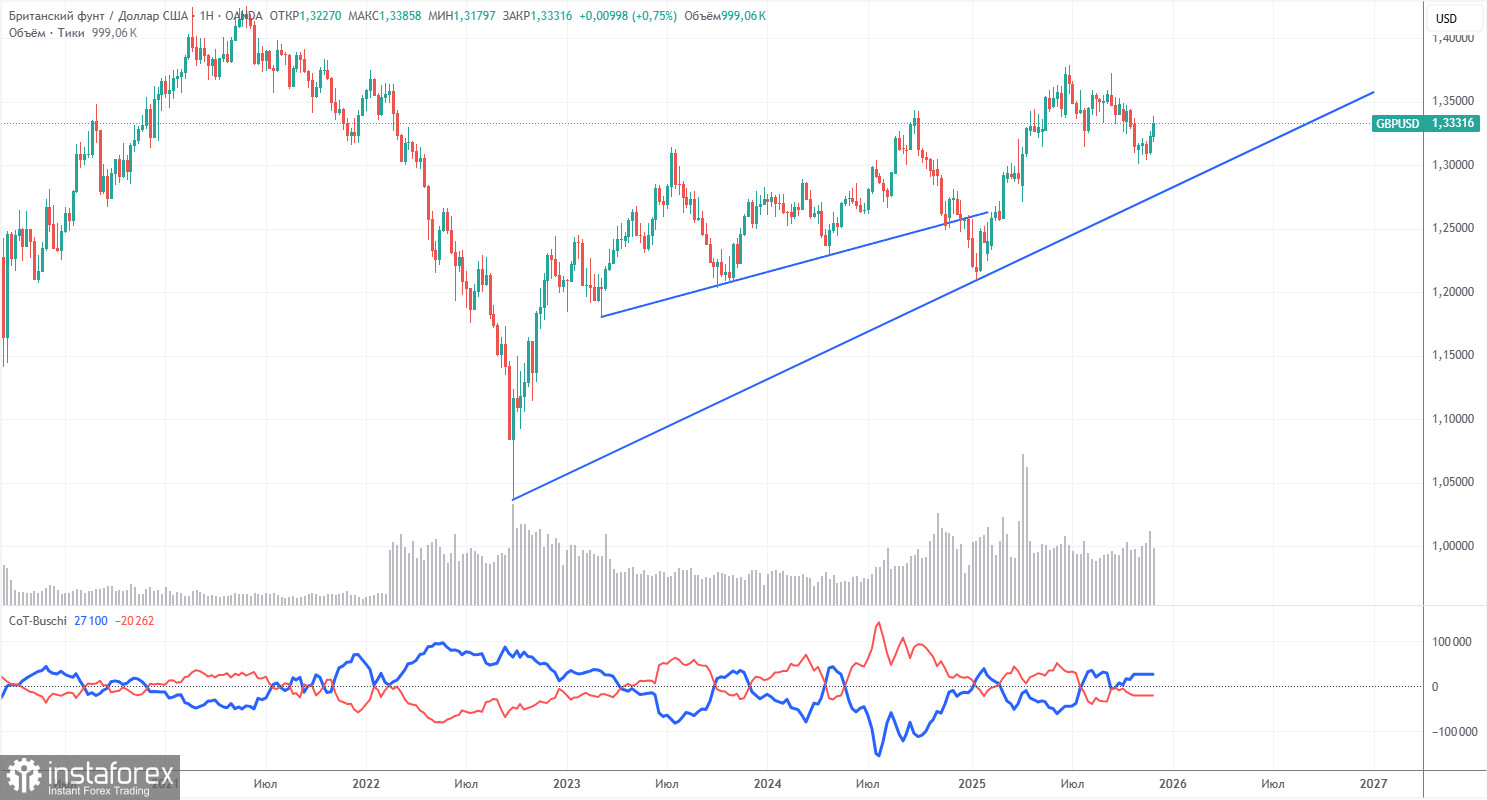
COT reports on the British pound show that sentiment among commercial traders has been changing frequently in recent years. The red and blue lines, representing the net positions of commercial and non-commercial traders, constantly intersect and are often close to the zero mark. They are currently at nearly the same level, indicating a roughly equal number of buy and sell positions.
The dollar continues to decline due to Donald Trump's policies, as shown on the weekly timeframe (illustration above). The trade war will persist in one form or another for a long time. The Fed will undoubtedly lower the rate in the next 12 months. Demand for the dollar will decrease one way or another. According to the latest COT report (dated October 28) on the British pound, the "Non-commercial" group opened 7,000 BUY contracts and 10,500 SELL contracts. Thus, the net position of non-commercial traders decreased by 3,500 contracts over the week. However, this data is already quite outdated, and there is no fresh information.
In 2025, the pound rose significantly, but it should be understood that there is only one reason: Trump's policy. As soon as this reason is mitigated, the dollar may resume rising, but nobody knows when. It does not matter how rapidly the net position for the pound is increasing or decreasing (if it is decreasing). The net position for the dollar is falling in any case, and typically at a higher pace.
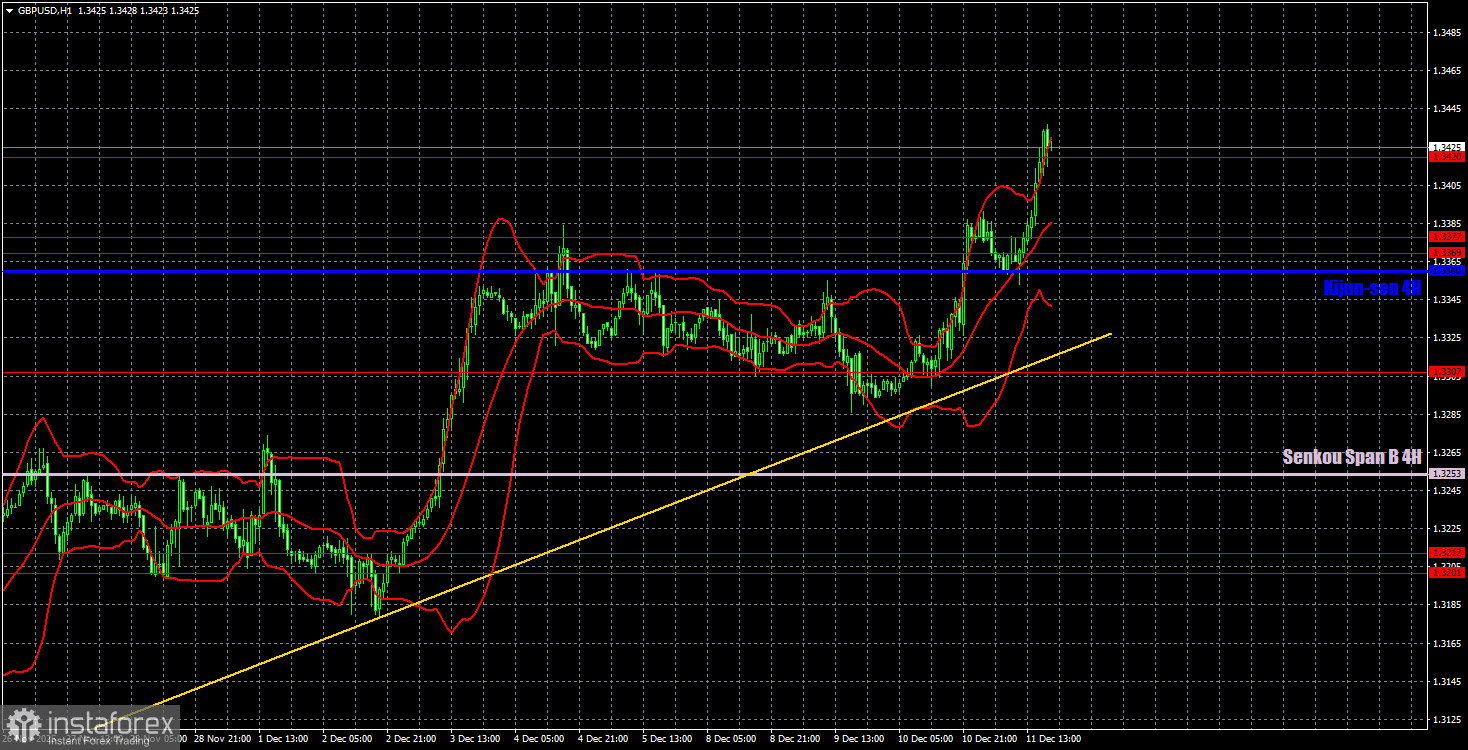
On the hourly timeframe, the GBP/USD pair continues to form an upward trend. We believe that medium-term growth will continue regardless of the local macroeconomic and fundamental backdrop, and that the correction on the daily timeframe will eventually conclude. Or it may have already concluded. However, in December, much will depend on U.S. labor market data, unemployment, and inflation, which will determine the future direction of Fed monetary policy.
For December 12, we highlight the following important levels: 1.2863, 1.2981-1.2987, 1.3042-1.3050, 1.3096-1.3115, 1.3201-1.3212, 1.3307, 1.3369-1.3377, 1.3420, 1.3533-1.3548, 1.3584. The Senkou Span B line (1.3253) and Kijun-sen (1.3360) can also serve as sources of signals. It is recommended to set the Stop Loss level to break even upon the price moving in the correct direction by 20 pips. The lines of the Ichimoku indicator may shift during the day, which should be considered when determining trading signals.
On Friday, two macroeconomic reports are scheduled for release in the UK. They are not among the most important. GDP and industrial production. It sounds significant, but in reality, the GDP report will be monthly, making it much less significant than quarterly or yearly reports. Both reports are likely to provoke only a minor market reaction. In the US, the event calendar is empty.
Today, traders may consider selling if the price bounces off the 1.3420 level with a target at 1.3369-1.3377. Long positions will again become relevant upon consolidation above 1.3420, with a target at 1.3533.


