
Lihat juga


 09.09.2026 05:53 AM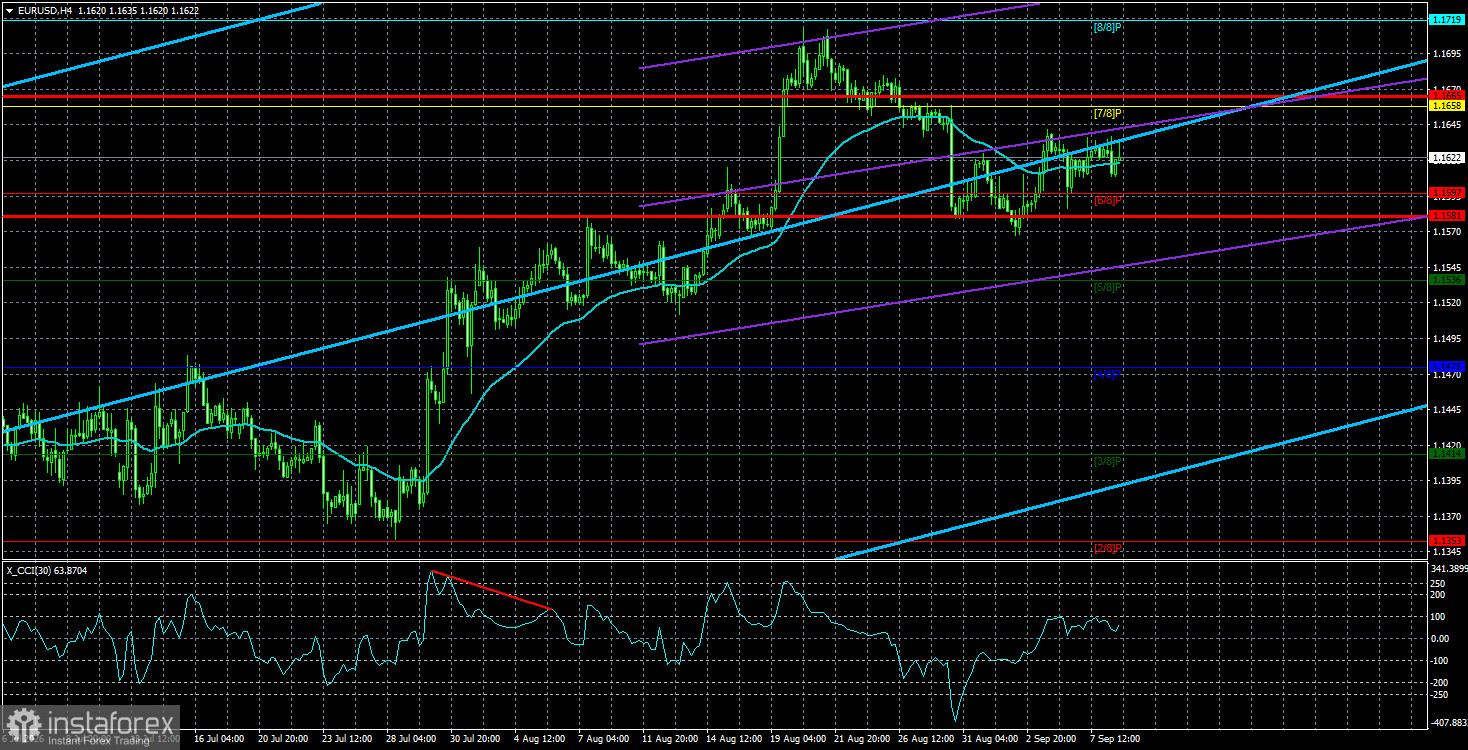
The EUR/USD currency pair again showed no interesting action on Tuesday. Traders have likely grown used to this, as volatility has remained low for almost six weeks. We have repeatedly said that low volatility essentially means a lack of market movement. How can you open trades and make profits if there are no moves? Therefore, we continue to regard volatility as one of the most important indicators of market condition and sentiment. If there are no moves, the market does not want to trade at the moment. So what should one expect from the euro or the dollar?
In recent weeks, we have seen the same pattern. The market moves roughly once a week when the most important report is released, or a major event occurs. In the past two weeks, those were the US Nonfarm Payrolls and the Treasury's decision to increase bond purchases. Excluding those three days, volatility has not exceeded 63 pips since August 1. What can we conclude? The market trades only the most important events and ignores everything else. Thus, it made no sense to expect a reaction to reports such as eurozone GDP or Germany's industrial production.
This week the market has two information targets. First — the European Central Bank meeting on Thursday; second — US inflation on Friday. Even these events do not guarantee market moves. For example, last Friday the US released the notable August Nonfarm Payrolls, yet overall daily volatility was only 50 pips. So the market can legitimately ignore even the most important reports. What to expect from the ECB? Traders already know: a hike in all three key rates. What to expect from US inflation? A continuation at about 3.4%.
Thus, if the ECB does what is expected, the market may see an emotional spike that fades as quickly as last Friday's reaction to Nonfarm. If US inflation prints exactly 3.4% for August, traders will have nothing new to react to because that value is already priced in. Only if Christine Lagarde outlines a new forward path for ECB policy and the US inflation report deviates from forecasts can one expect strong moves in the last two days of the week. Until Thursday — unlikely.
Is there any point in discussing the technical picture now? We believe the euro still has very good upside prospects across timeframes. But remember: currencies do not move because of technicals or fundamentals alone. The technical picture only reflects market sentiment, and fundamentals shape traders' moods. The market moves because traders make trades. Without trades, neither technique nor fundamentals will help.
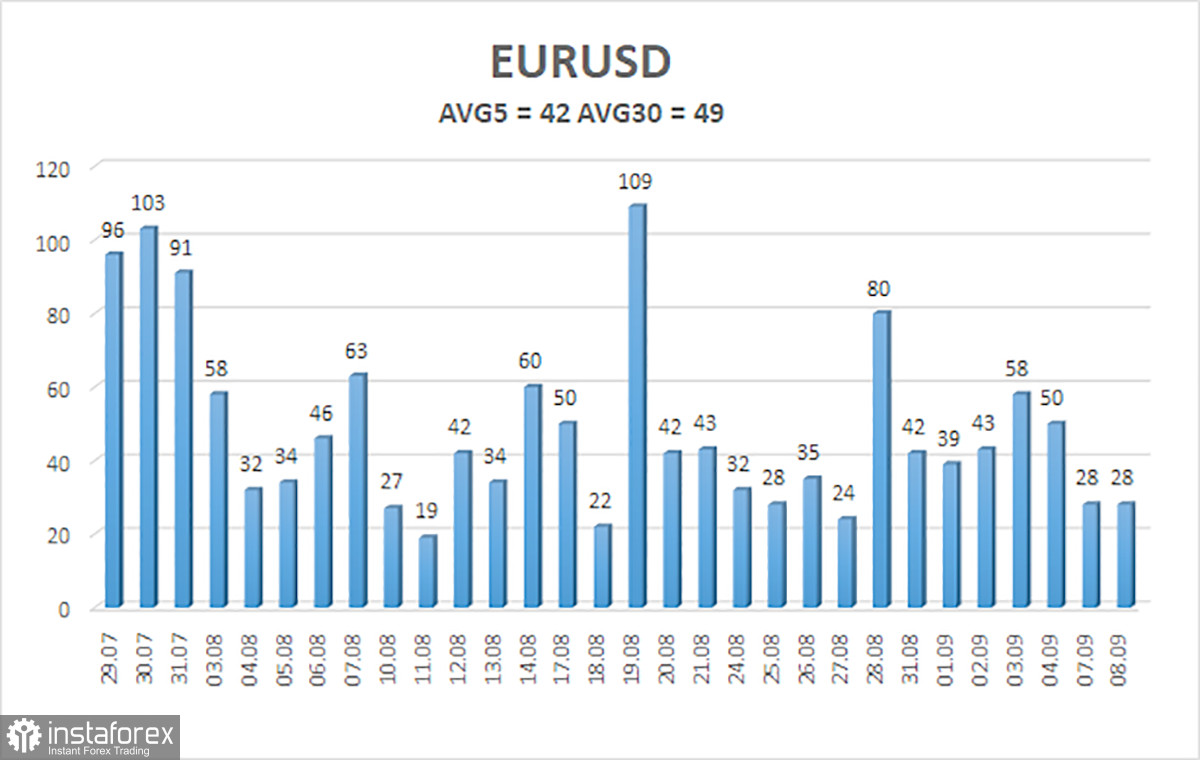
Average volatility of the EUR/USD pair over the last 5 trading days as of September 9 is 42 pips and is characterized as "mid-low." We expect the pair to move between 1.1581 and 1.1665 on Wednesday. The major linear-regression channel has turned up, indicating an uptrend. The CCI entered oversold territory, warning of a possible end to the correction.
S1 – 1.1597
S2 – 1.1536
S3 – 1.1475
R1 – 1.1658
R2 – 1.1719
R3 – 1.1780
The EUR/USD pair continues an uptrend on the 4-hour timeframe, which may be the start of a new leg of a global uptrend on higher timeframes. The global fundamental backdrop for the dollar remains negative, though in 2026 geopolitics and later the Fed's hawkish tilt provided strong support for the US currency. Those factors no longer support the dollar now. With the price below the moving average, consider short positions on a corrective basis, targeting 1.1581 and 1.1536. Above the moving average, long positions remain relevant with targets at 1.1665 and 1.1719.
Regression channels help determine the current trend. If both are directed in the same direction, it means the trend is currently strong;
The moving average line (settings 20,0, smoothed) defines the short-term trend and the direction in which trading should be conducted at present;
Murray levels are target levels for moves and corrections;
Volatility levels (red lines) are the probable price channel within which the pair will spend the next 24 hours based on current volatility indicators;
The CCI indicator – its entry into the oversold area (below -250) or the overbought area (above +250) indicates that a trend reversal in the opposite direction is approaching.


