
Lihat juga


 31.08.2026 10:08 AM
Bitcoin and Ether posted a sharp rally that is now clearly fading. The Treasury's decision to increase bond buybacks triggered a surge in the crypto market, but the key question remains how long the move can continue if it rests on a single supporting factor. In essence, it was a black swan event that arrived at the most unexpected moment. Despite the strong rally in both cryptocurrencies, we do not believe the downtrend is over. The fundamental backdrop remains weak for the crypto segment, and the downtrends in both ether and bitcoin remain intact. We still see no grounds for a sustained advance. The outlook for crypto has become much more optimistic, but we warn traders that this may be a pump or a manipulation.
We would also draw traders' attention to one important fact. The US Treasury will not increase long-dated bond buybacks until September 9. In other words, liquidity flows will not begin to hit markets for at least another 10 days. Why, then, did bitcoin and the broader crypto market rally in August when no additional liquidity had yet reached markets? The answer is that the market priced in an event that had not yet happened. Clearly, the new liquidity flows will support the asset, but that rise may already have occurred. We believe this factor may already be fully priced. Or will Bitcoin first rise on anticipation and then again on implementation?
Meanwhile, Standard Chartered said bitcoin could return to $126,000 before the end of this year and that the asset's rally could accelerate after October 6. Geoff Kendrick, head of digital asset research, said the latest leg of bitcoin's rise was driven mainly by short covering, but that inflows into spot ETFs have also begun to increase. Earlier, Kendrick doubted even a $100,000 target would be reached in 2026, but his confidence has now increased. This is exactly what we have said repeatedly: as soon as Bitcoin posts even a moderately confident rise, experts immediately begin to forecast a bullish trend and a new all-time high.
It should also be noted that at the start of the year the bank cut its 2026 forecast from $150,000 to $100,000. That once again highlights an interesting pattern. When bitcoin rises, forecasts rise. When bitcoin falls, forecasts fall as well. If bitcoin begins to fall tomorrow, forecasts will immediately change. It should also be noted that many independent experts, who have no vested interest in bitcoin rising indefinitely, say the asset could still return to the $50,000–$60,000 area per coin before beginning a new bullish trend. It is also noted that the $82,000–$83,000 area per coin is strong resistance for bitcoin.
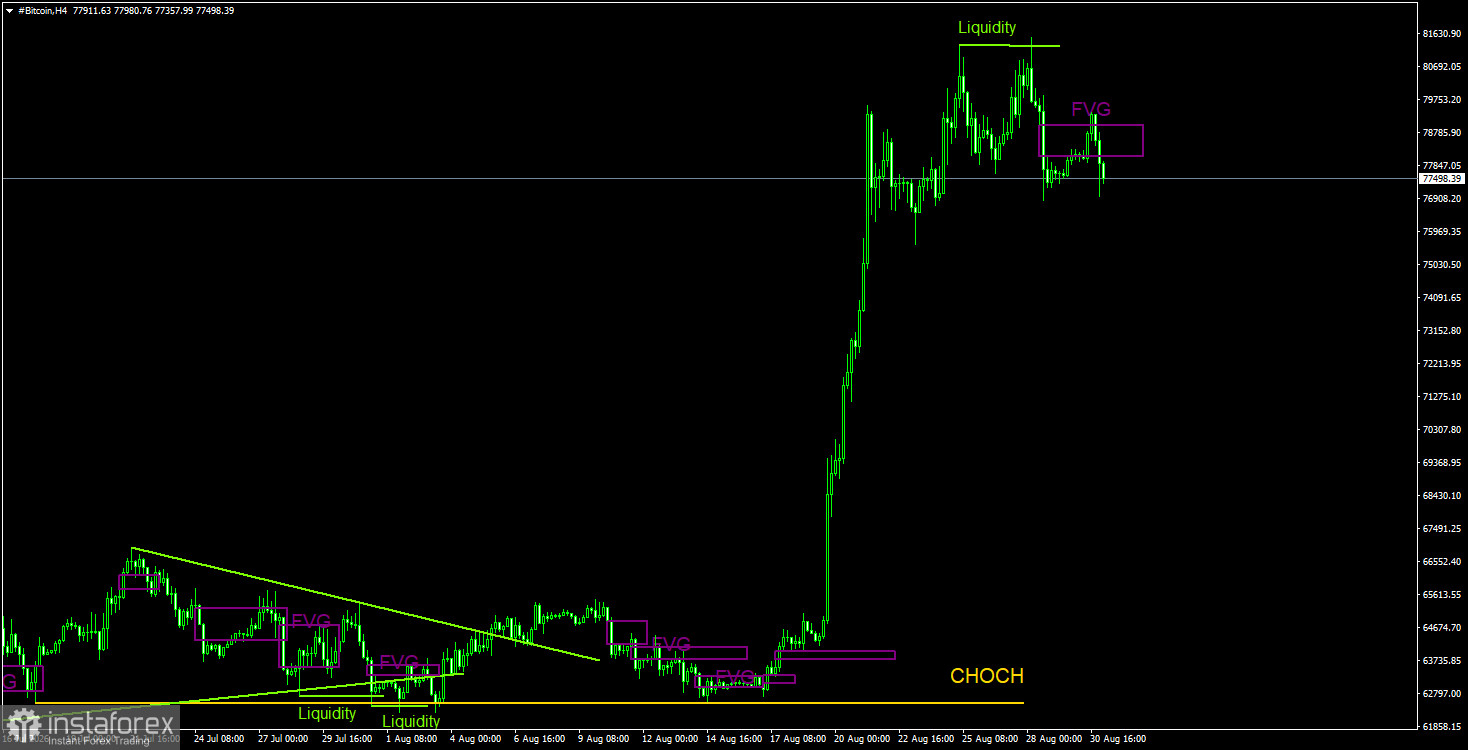
Trading recommendations for BTC/USD:
Bitcoin continues to form a downtrend despite the strong rise a week earlier. We continue to expect a decline toward $57,500 (the 61.8% Fibonacci level of the three-year uptrend), although that level has, in essence, already been worked off. Even so, we do not believe the downtrend has ended there. The current rise in the first cryptocurrency looks only weakly like a correction, but that is not a sufficient reason to open longs. The current move looks most like a pump. Liquidity may be taken from the high at $82,850, which may trigger a decline in Bitcoin and confirm a transition to sideways movement. On the 4-hour time frame, a new leg lower may be expected from the latest bearish FVG.
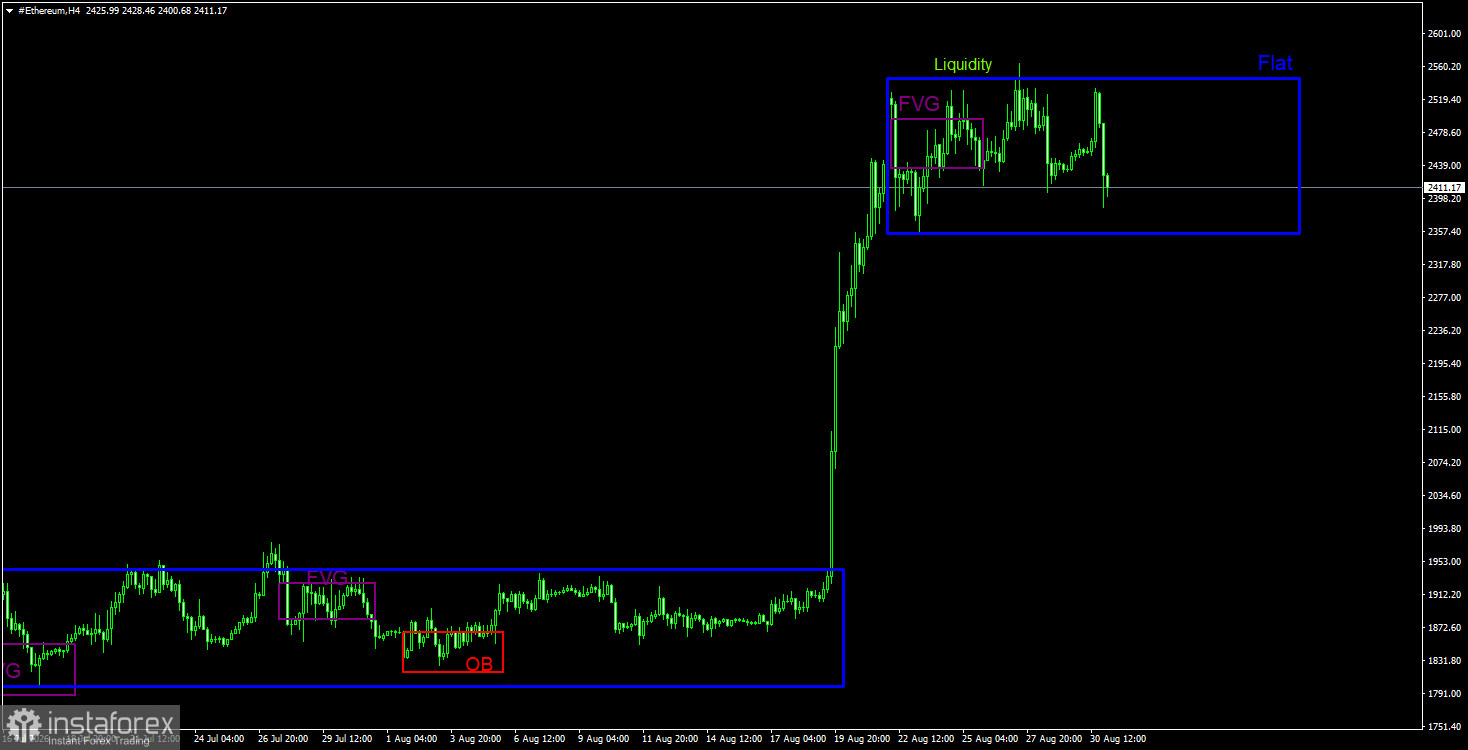
Trading recommendations for ETH/USD:
On the daily time frame, the technical picture has changed completely in just a few days. Ether may now begin a new uptrend. However, traders can currently rely only on the weekly chart, where Ether may head toward the $4,800 level, which serves as the upper boundary of a five-year sideways channel. In any case, to open positions, the market needs to calm down and form new, clearer patterns. On the daily time frame, the nearest bearish FVG has been worked off, but that FVG belongs to the previous trend. If it triggers a market reaction, that reaction will most likely be corrective. We also note a liquidity grab above the April 17 high and another liquidity grab on the 4-hour time frame. Bitcoin has also taken liquidity on the 4-hour chart. Thus, at a minimum, a correction is brewing, although a flat has already formed on the 4-hour time frame.
Explanations to the illustrations:
CHOCH—a break in trend structure.
Liquidity—liquidity, stop losses, and pending orders that market makers use to build positions.
FVG—an area of price inefficiency. Prices move through such areas very quickly, indicating the complete absence of one side of the market. Prices later tend to return to such areas and react to them in continuation of the main trend.
IFVG—inverted fair value gap. After returning to such an area, price does not react to it but instead breaks through impulsively and then retests it from the other side.
OB—order block. A candle where a market maker opened a position in order to take liquidity and form its own position in the opposite direction.


