यह भी देखें

 11.05.2026 07:06 AM
The situation in the cryptocurrency market remains unfavorable for trading. Despite the ongoing downward trend and the complete absence of signs of a shift to a "bullish" market, Bitcoin has been in a corrective phase for almost 3 months. The nearest "bearish" FVG on Bitcoin's path north has elicited only a very weak market reaction. Thus, the first important POI area for sales was essentially ignored (but the pattern is still not canceled). Therefore, Bitcoin may head towards the second-nearest bearish FVG, within which we will again expect the correction to complete and sell signals to form. In the last week, "digital gold" has faced significant problems despite weak growth.
It is worth noting that many traders have identified the $78,000-$81,000 range as crucial for Bitcoin. In this area, many traders who opened long positions over the past six months reached breakeven on their trades. Consequently, they may start closing them, which will significantly increase supply in the market. It should also be noted that Strategy may begin selling Bitcoin soon (as Michael Saylor stated), which will further raise supply on exchanges and could prompt other traders to sell. Additionally, peace in the Middle East (which could theoretically support risk assets) has yet to materialize. This morning, it became known that Donald Trump was dissatisfied with another Iranian proposal for ending the war and achieving long-term peace. We do not know what this proposal entailed, nor do we know what any of the previous ones entailed. The markets are left to speculate on what Washington and Tehran are negotiating. However, as we can see, progress is minimal. We remain highly skeptical of this deal, as Iran and the US have opposing demands.
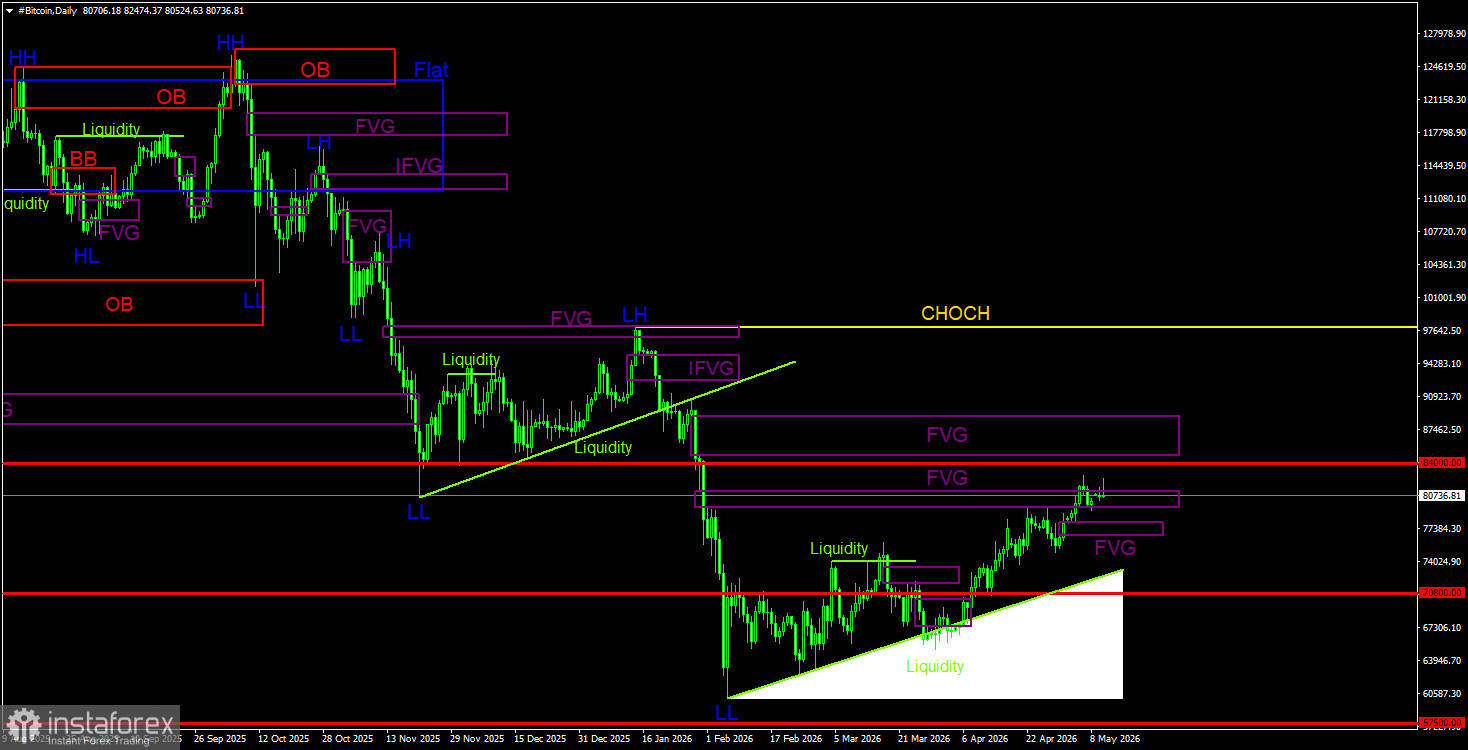
On the daily timeframe, Bitcoin continues to form a downward trend and a correction against it. The trend structure is identified as bearish, and the CHOCH line remains at the level of $97,900. Only above this level can one consider the downward trend to be over. Given no signs of a trend reversal to the upside, we believe the decline will resume sooner or later. On the daily timeframe, the nearest POI area for new short positions is between $79,500 and $81,100. This area has been tested twice, and the price reaction to it was very weak. Thus, it is likely that this pattern will be canceled, and Bitcoin will continue to rise towards the next FVG in the range of $84,900-$88,800. The liquidity pool below the trend line remains the target for the price. A small "bullish" FVG has also been formed. The reaction to it may signal the continuation of the correction and allow traders to open small long positions.
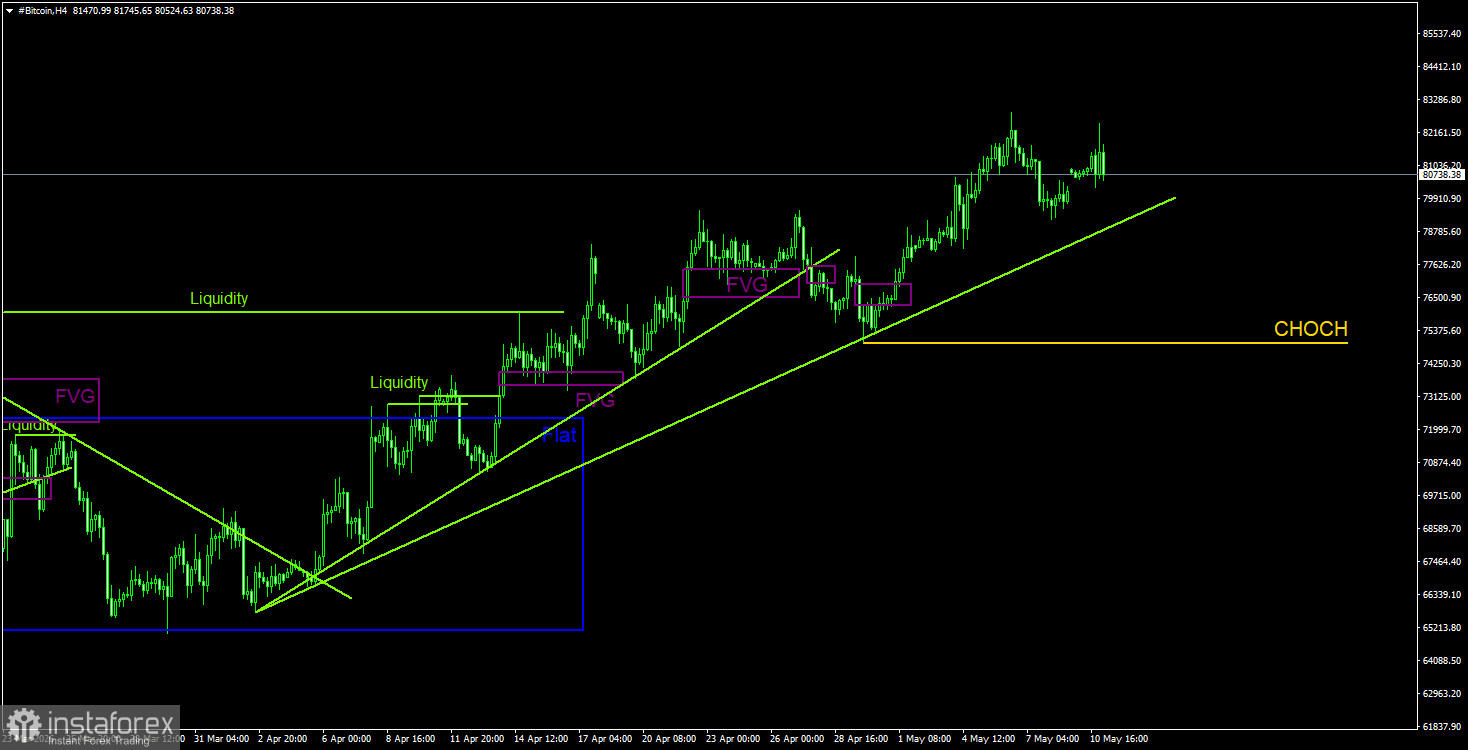
On the 4-hour timeframe, Bitcoin continues its upward movement, which is still a correction. The CHOCH line of the current upward structure is at $74,950; a stabilization below this level will signal a trend reversal. This could be a very important signal for the market concerning a trend change. The end of the upward trend on the 4-hour timeframe could mark the starting point for a new wave of trend on the daily timeframe. There are still no fundamental grounds for Bitcoin's long-term strengthening.
Bitcoin continues to form a full-fledged downward trend and a correction against it. We continue to expect a decline, targeting $57,500 (the 61.8% Fibonacci level from the three-year upward trend), and there are currently no signs of a trend reversal. The only POI area at the moment is the nearest bearish FVG on the daily timeframe, located in the range of $79,300 - $81,200. It has not been completely canceled yet, but it could be canceled soon. In this case, the POI area for sales will be $84,900-$88,800 (the next bearish FVG). Decline targets remain below the $60,000 level. For long positions, one can use the single bullish FVG on the daily timeframe, but it should be noted that any current growth in the cryptocurrency is inherently a correction.

