See also

 30.03.2023 07:50 AM
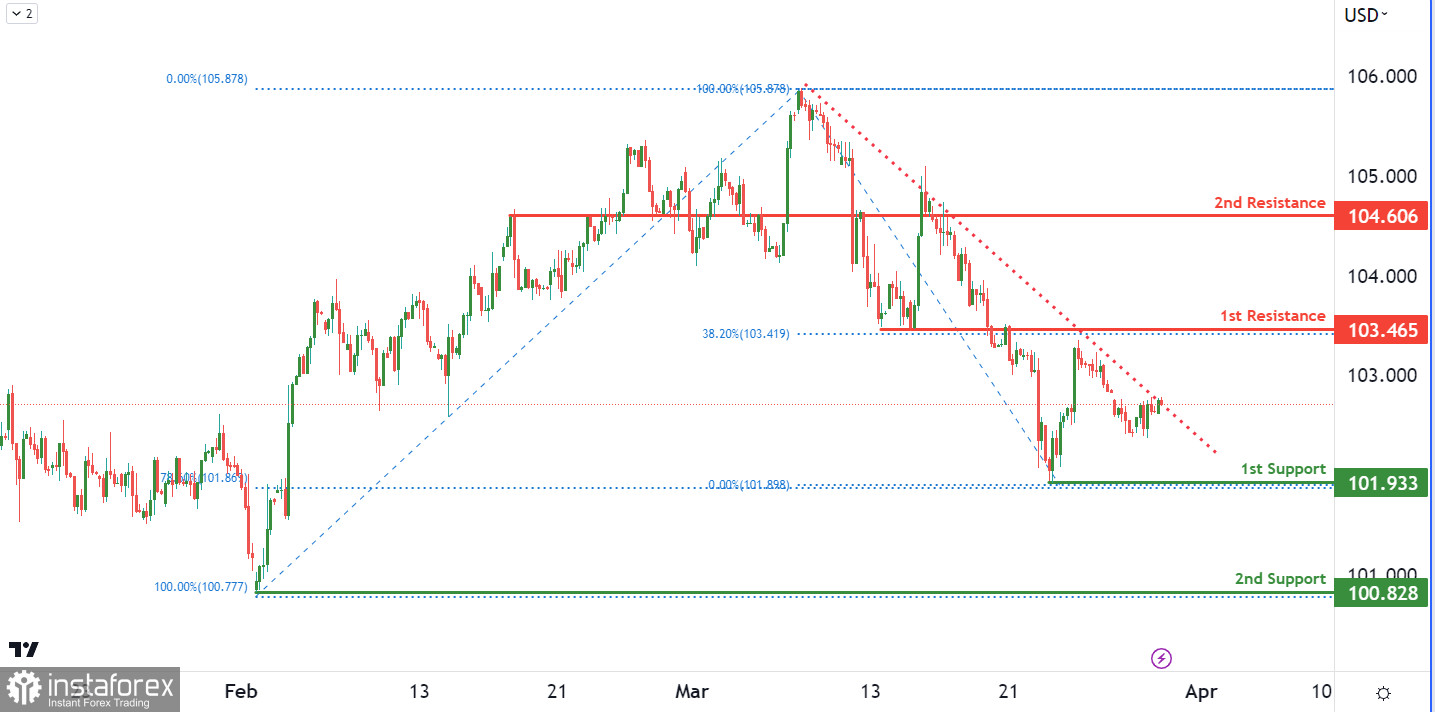
The DXY index is currently displaying strong bearish momentum, trading below a significant descending trend line, indicating further potential for price drops.
If the trend continues, the index could decline towards its first support level at 101.93, which is a multi-swing low support level and conjoins the 78.60% Fibonacci retracement level. A breach of this support could cause prices to fall further to the second support level at 100.82, a swing low support.
However, if the index rises, it could encounter resistance at the first resistance level of 103.46, an overlap resistance level that also corresponds to the 38.20% Fibonacci retracement level. Breaking this resistance level could lead to the next level of resistance at 104.60, which is also an overlap resistance level.
You have already liked this post today
*The market analysis posted here is meant to increase your awareness, but not to give instructions to make a trade.


