See also

 30.03.2023 07:51 AM
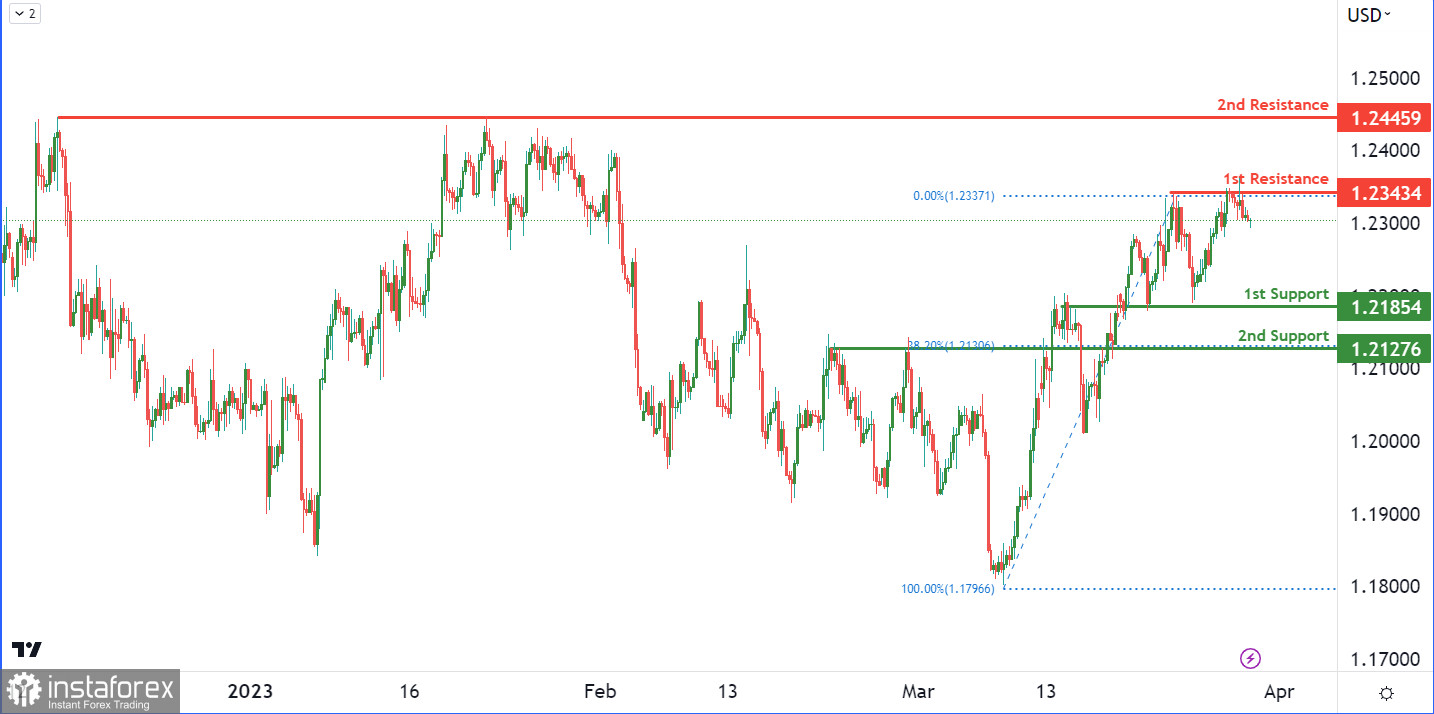
The GBP/USD chart shows a bearish momentum, indicating the possibility of price continuing its decline towards the first support level. Presently, the price is testing the first resistance level at 1.2343, which is a multi-swing high resistance level. A failure to break through this resistance could initiate a bearish move towards the first support level at 1.2185. This level is a robust overlap support, confluencing with a 38.20% Fibonacci retracement.
If the first support level is broken, the price could sustain its bearish momentum towards the second support at 1.2127. This level is also an overlap support and has a 38.20% Fibonacci retracement lining up with it. On the way up, there are two strong resistance levels, with the first being 1.2343, as mentioned before, and the second at 1.2445, which is a multi-swing high resistance level.
You have already liked this post today
*The market analysis posted here is meant to increase your awareness, but not to give instructions to make a trade.


