See also

 30.03.2023 07:52 AM
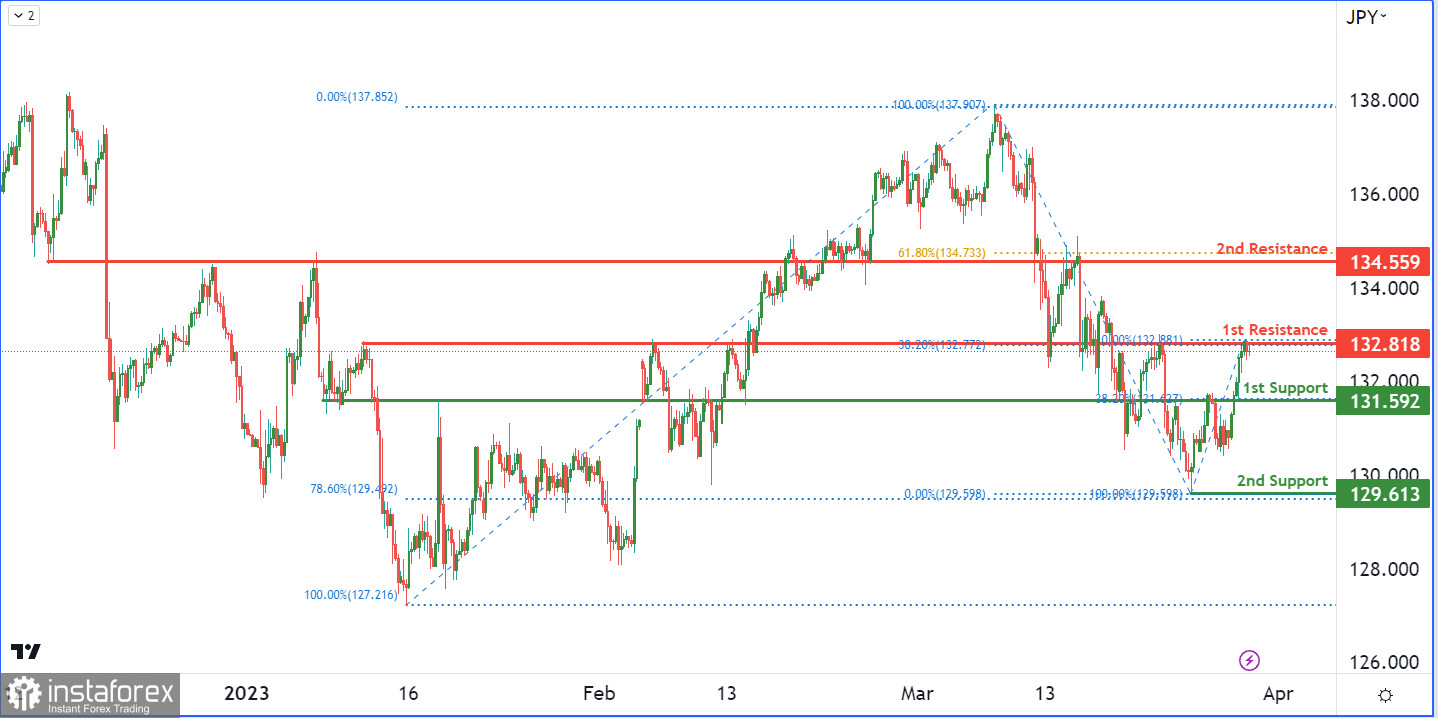
The USD/JPY chart maintains a bearish momentum overall, indicating that the price could potentially react negatively to the first resistance level and drop towards the first support level. The first support at 131.59 is a robust level, coinciding with an overlap support and a 38.20% Fibonacci retracement. Should the price break below this support, it may continue to the next support level at 129.61, which is a multi-swing low support and a 78.60% Fibonacci retracement.
Conversely, the first resistance at 132.81 is a significant level as it aligns with an overlap resistance and a 38.20% Fibonacci retracement. A breakthrough of this resistance could prompt the price to ascend towards the second resistance level at 134.55, an overlap resistance and a 61.80% Fibonacci retracement.
You have already liked this post today
*The market analysis posted here is meant to increase your awareness, but not to give instructions to make a trade.


