See also

 31.03.2023 08:11 AM
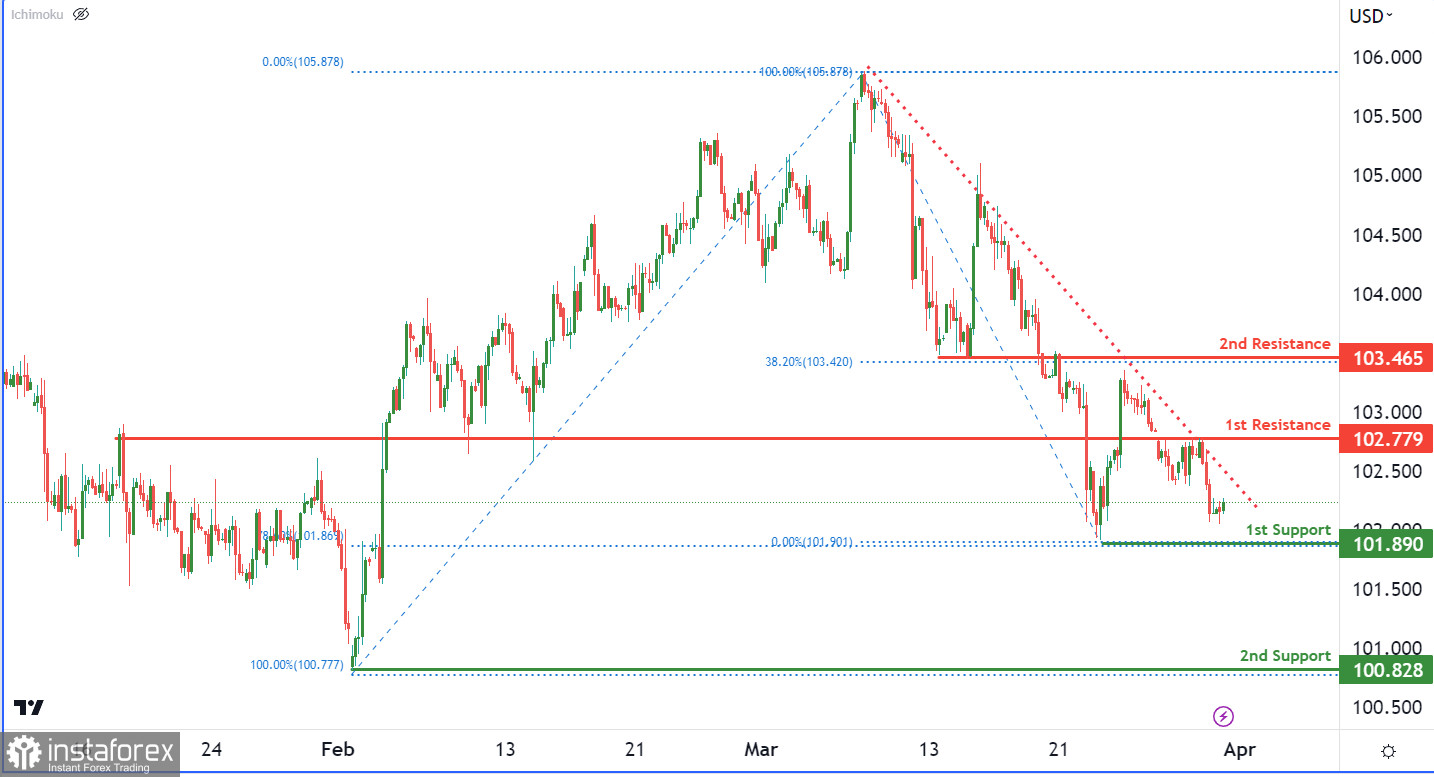
The DXY chart displays bearish momentum, with prices below a significant descending trendline. The first support level at 101.89, a swing low support, coincides with a 78.60% Fibonacci retracement level, making it a strong level to watch. The second support level at 100.82 is also a swing low support. Meanwhile, the first resistance level at 102.77, an overlap resistance, may act as a strong level to watch if prices rise. Breaking through this level could lead to a rise towards the second resistance level at 103.46, an overlap resistance coinciding with a 38.20% Fibonacci retracement level.
You have already liked this post today
*The market analysis posted here is meant to increase your awareness, but not to give instructions to make a trade.


