See also

 26.03.2024 03:48 PM
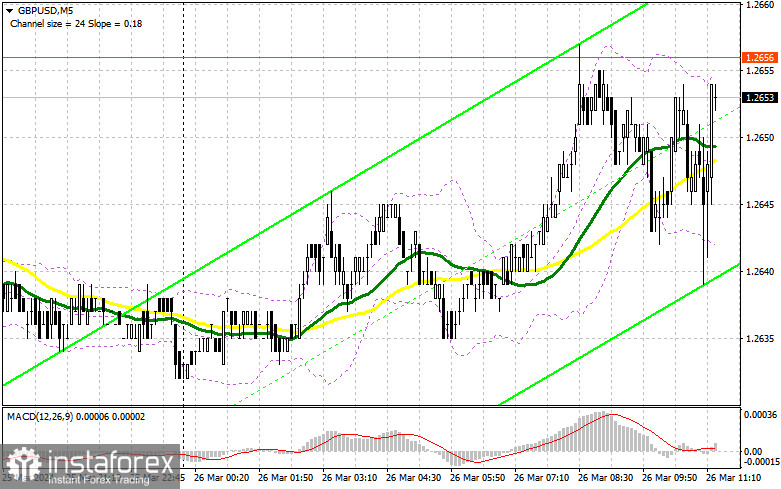
In my morning forecast, I focused on the level of 1.2623 and planned to make decisions based on it for market entry. Let's look at the 5-minute chart and figure out what happened there. There was a decline, but we never reached the test and formed a false breakout. Therefore, suitable entry points into the market were not obtained. The technical picture remained unchanged for the second half of the day.
To open long positions on GBP/USD:
In the absence of UK statistics, pound buyers were less active than the day before. In the second half of the day, attention should be paid to the figures for changes in durable goods orders and the consumer confidence index in the USA. An increase in consumer confidence due to a stable economy could bring demand back to the dollar, leading to a fairly decent decline in the pair, returning the pound to the bearish market framework from which buyers are currently trying to break out. In the event of a downward movement of the pair, only the formation of a false breakout around 1.2623, where moving averages intersect, will provide an entry point for growth towards the resistance at 1.2673, formed at the end of last week. A breakout and test of this range from top to bottom will strengthen the chances of further recovery of GBP/USD, leading to new purchases and allowing it to reach 1.2708. If the pair moves above this range, it could indicate a surge towards 1.2756, where I plan to take a profit. In the scenario of a GBP/USD decline and the absence of buyers at 1.2623 in the second half of the day, everything depends on the US data; sellers will have a chance for a larger pound drop toward the monthly minimum of 1.2576. Buying will only be considered on a false breakout. Opening long positions on GBP/USD on a rebound can be considered from 1.2535, with a target correction of 30-35 points within the day.
To open short positions on GBP/USD:
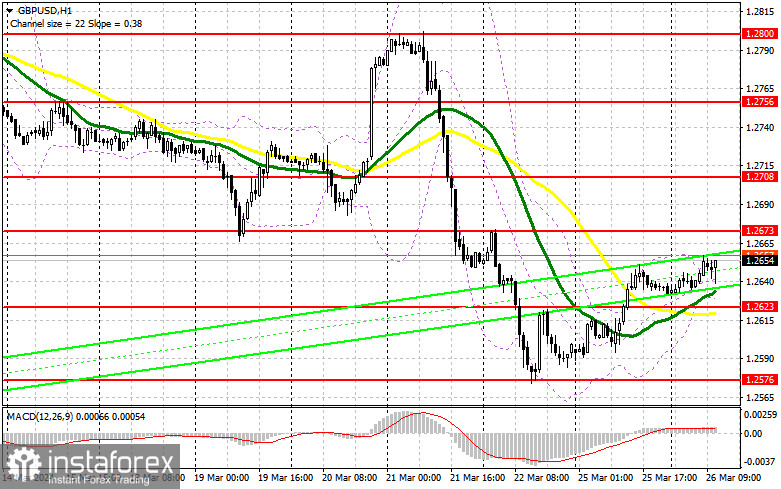
Bears also have a chance to further establish a trend but to do this; they need to regain control of the market. The formation of a false breakout around the new resistance at 1.2673 will convince traders of the presence of major sellers, providing an entry point for short positions targeting a decline and a test of support at 1.2623, which we failed to reach in the first half of the day. A breakout and reverse test from the bottom to the top of this range will increase pressure on the pair, giving bears an advantage and another entry point for selling towards a retest of 1.2576, where I expect more active buyer involvement. The ultimate target will be the minimum at 1.2535, where I will take a profit. In the scenario of GBP/USD growth and the absence of bears at 1.2673 in the second half of the day, bulls will have a chance to continue the upward correction towards the resistance at 1.2708. I will also wait for a false breakout there before considering selling. If there is no activity there as well, I advise opening short positions on GBP/USD from 1.2756, counting on a pair rebound downwards by 30-35 points within the day.
Indicator Signals:
Moving Averages:
Trading is conducted above the 30 and 50-day moving averages, indicating further pair growth.
Note: The period and prices of moving averages are considered by the author on the H1 hourly chart and differ from the general definition of classical daily moving averages on the D1 daily chart.
Bollinger Bands:
In case of a decline, the lower boundary of the indicator will act as support around 1.2625.
Description of Indicators:
You have already liked this post today
*The market analysis posted here is meant to increase your awareness, but not to give instructions to make a trade.


