See also

 28.03.2024 06:42 AM
EUR/USD
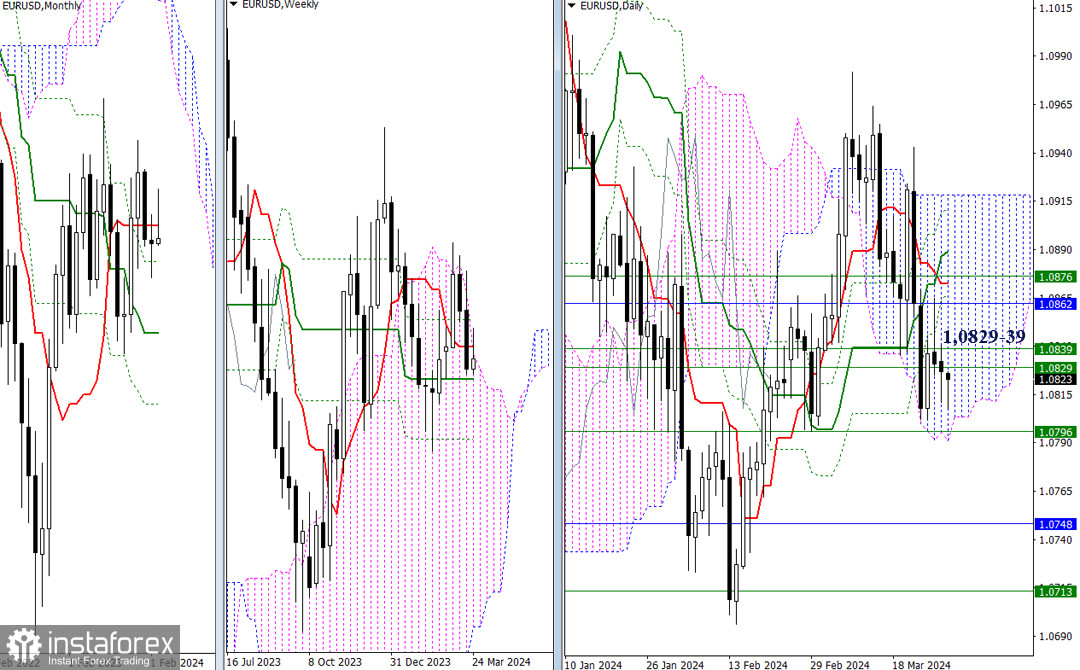
Higher Timeframes
Yesterday, the bears failed to confirm and continue the decline initiated the day before. As a result, the attraction and influence of weekly levels (1.0829-39) restrain the development of the situation, which may contribute to the formation of consolidation. The remaining benchmarks of this market segment today maintain their positions, so the manifestation of activity may lead to their testing. Thus, bears still await support in the area of 1.0796 (weekly medium-term trend + lower boundary of the daily cloud), while on the path of bulls, the resistance zone of 1.0862-76 remains.
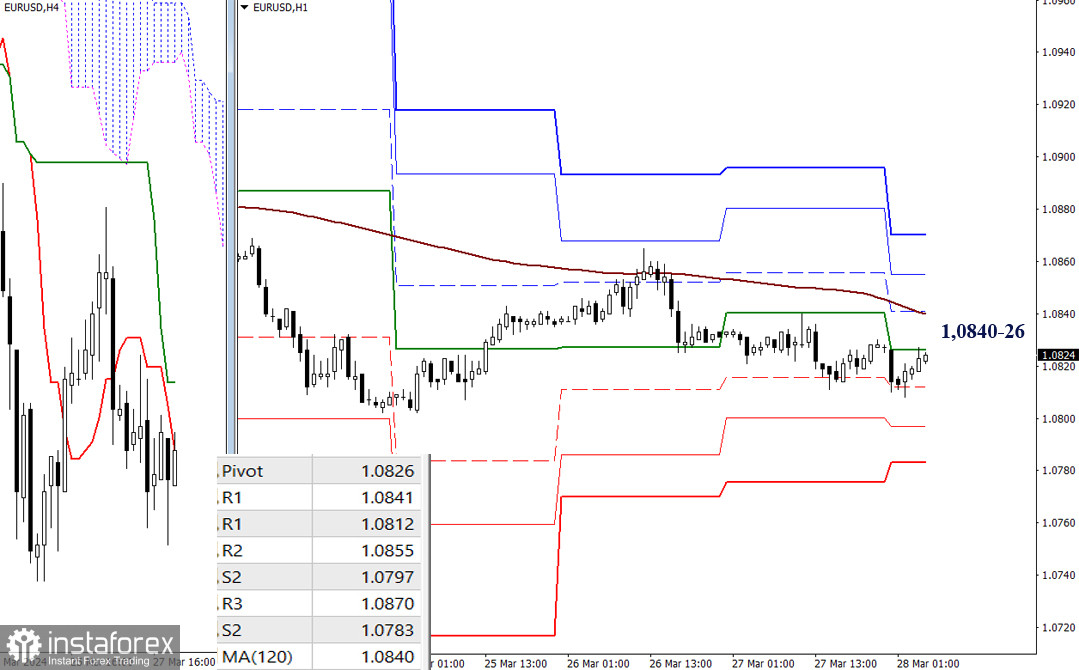
H4 – H1
On lower timeframes, the advantage remains on the side of the bears. The market continues to explore key levels, which today are at the levels of 1.0826 (central pivot point of the day) – 1.0840 (weekly long-term trend). Overcoming key levels can change the balance of power. In the case of movement development, other benchmarks today will meet the market at 1.0797 – 1.0783 (support of classic levels) and 1.0855 – 1.0870 (resistance of classic pivot points).
***
GBP/USD
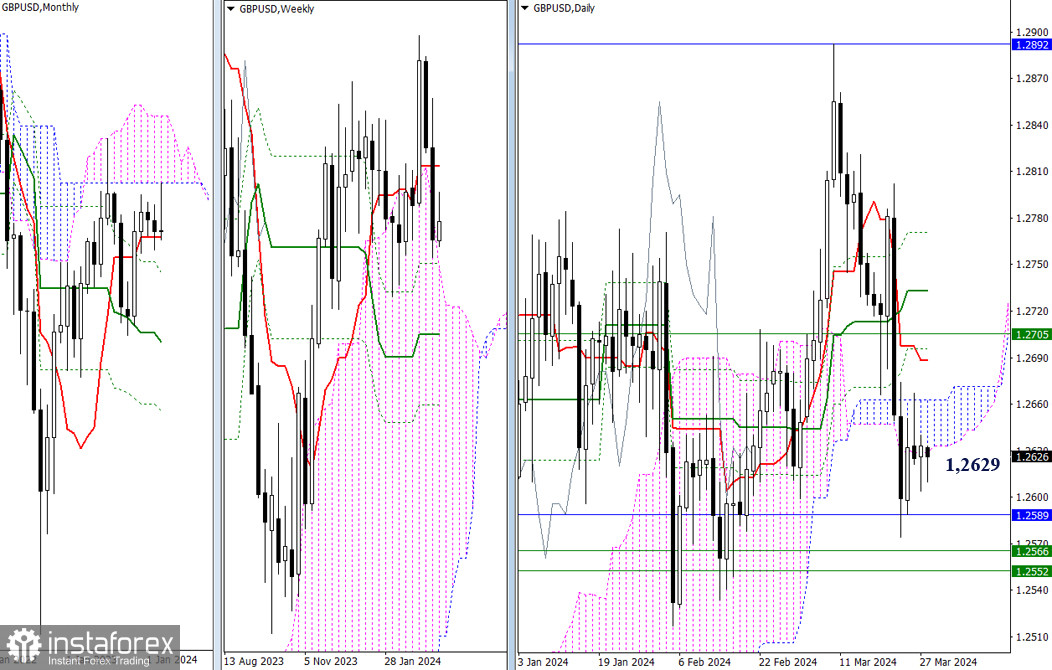
Higher Timeframes
The continuation of an active descent did not occur. The market is consolidating around the lower boundary of the daily Ichimoku cloud (1.2629). If uncertainty is replaced by activity from one side, movement development can receive an impulse. For bulls, it will be important first to rise and interact with the upper boundary of the daily cloud (1.2662), the daily short-term trend (1.2688), and the weekly short-term trend (1.2705). The interests of bears will be directed towards passing through the supports of the monthly short-term trend (1.2589) and the weekly levels (1.2552-66).
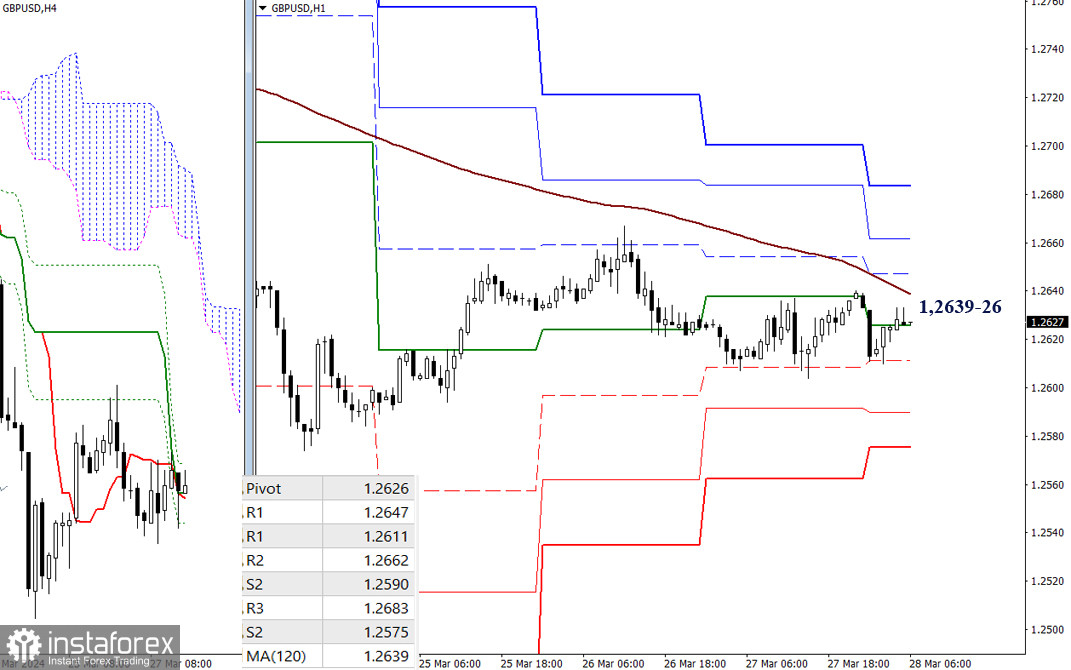
H4 – H1
On lower timeframes, the pound continues to test the attraction zone of key levels, which today are within 1.2639-26 (central pivot point + weekly long-term trend). Trading below key levels maintains the main advantage on the bears' side. Bearish benchmarks today are at the levels of 1.2611 – 1.2590 – 1.2575 (support levels of classic pivot points). Bullish benchmarks today are at 1.2647 – 1.2662 – 1.2683 (resistance levels of classic pivot points).
***
The technical analysis of the situation uses:
Higher timeframes - Ichimoku Kinko Hyo (9.26.52) + Fibonacci Kijun levels
Lower timeframes - H1 - Pivot Points (classic) + Moving Average 120 (weekly long-term trend)
You have already liked this post today
*The market analysis posted here is meant to increase your awareness, but not to give instructions to make a trade.


