See also

 29.04.2024 03:00 AM
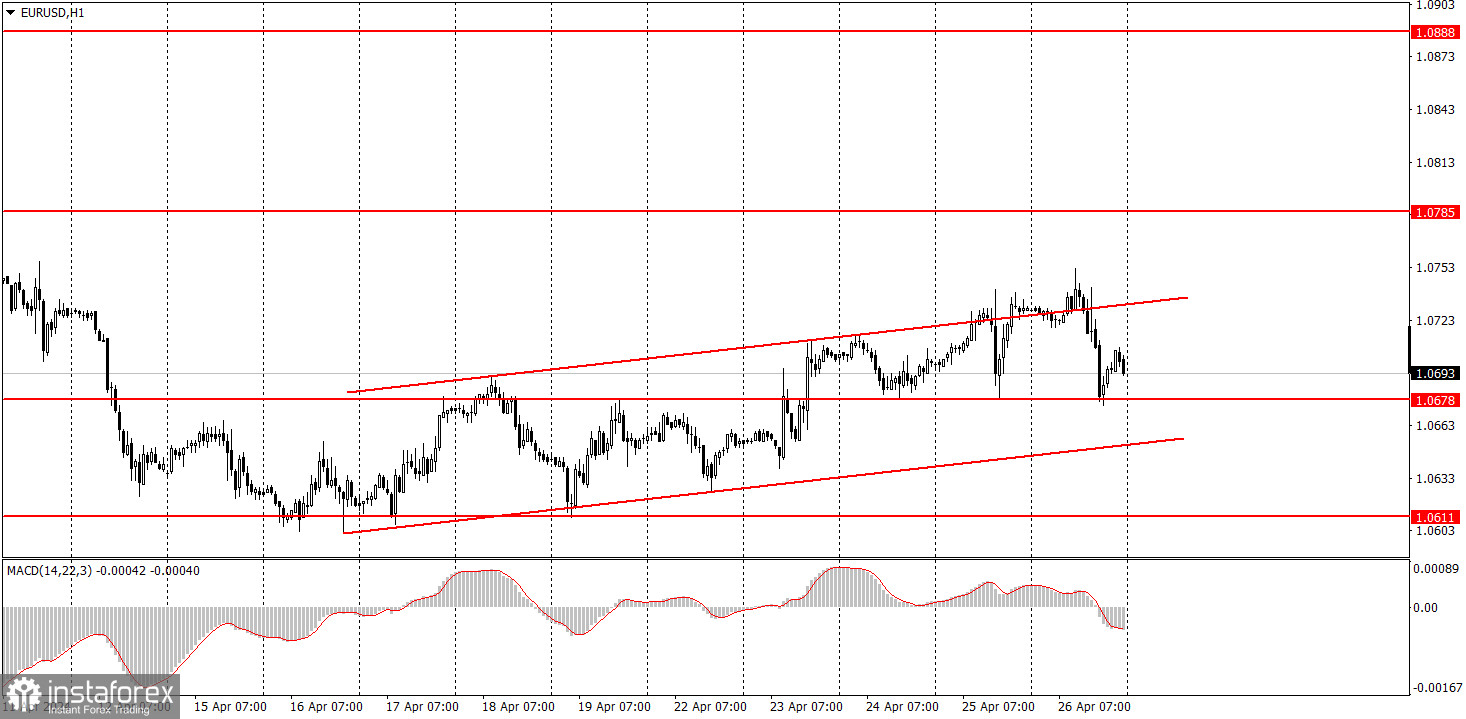
For Monday, the lineup of macroeconomic events is practically quiet. We will only highlight the German inflation report because inflation data are currently significant for the market. Inflation is a key indicator for the European Central Bank. If inflation in Germany or the EU doesn't rise in April, then this will answer the question regarding the ECB rate cut in June. The German indicator is expected to rise, but the value of 2.3% does not differ significantly from the value of 2.2%. Therefore, in any case, the indicator will remain very close to the target level, which allows the ECB to start easing monetary policy. If inflation sharply spikes, then one should expect a new upswing in the euro, because in this case, the ECB may postpone the rate cut from June to a later date.
From Friday's fundamental events, only a speech by Luis de Guindos from the European Central Bank stood out. However, as we have already mentioned, the market isn't raising questions about the ECB's monetary policy, so we didn't expect the ECB vice president to provide the market with anything new or significant. Both pairs continue their bullish correction, and that's the most important thing at the moment. The downtrend is not yet over. A series of weak reports from the US should not stop the dollar's rise.
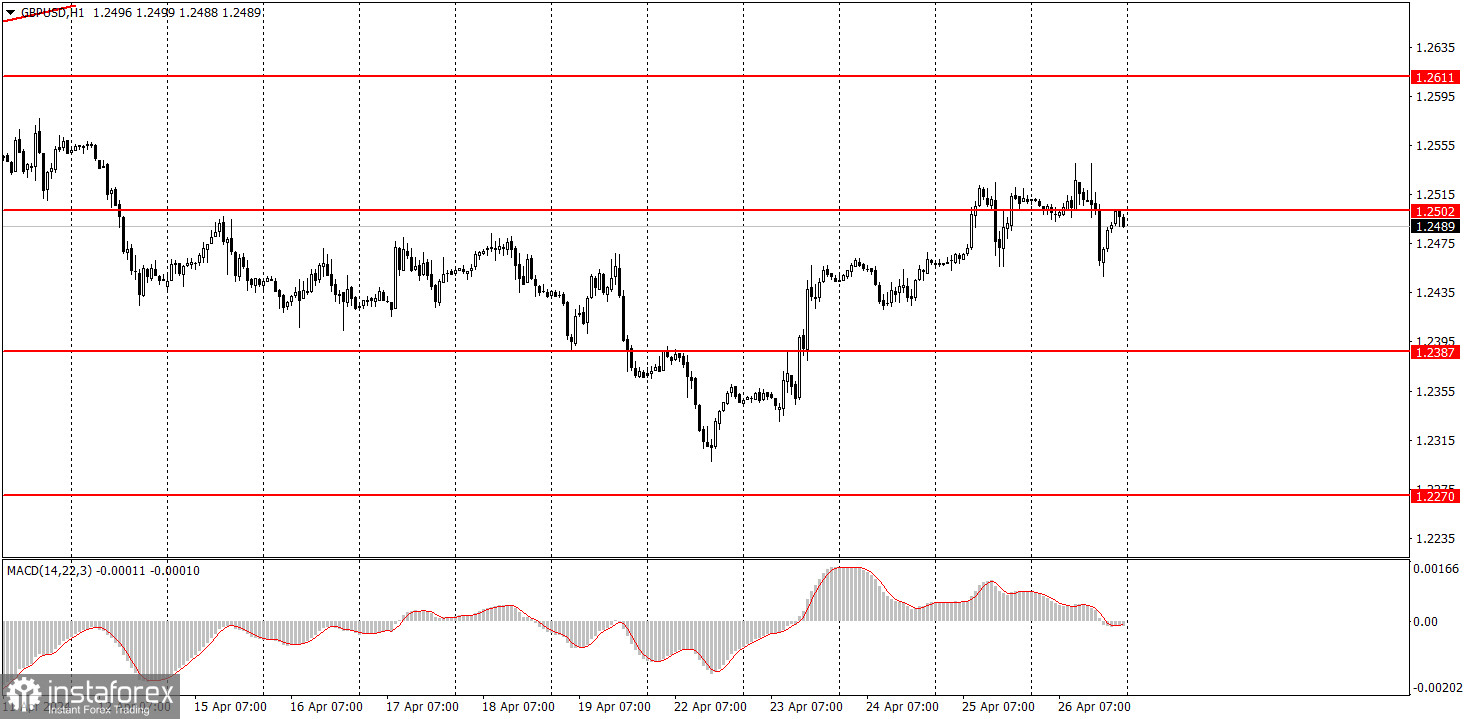
Today, novice traders should pay attention to the German inflation report. For the euro, the technical picture is clear at the moment; it's an ascending channel that clearly shows the range and direction in which the pair may trade in the near future. As for the pound, as usual, things are more complicated, but it is also going through a corrective phase.
1) Signal strength is determined by the time taken for its formation (either a bounce or level breach). A shorter formation time indicates a stronger signal.
2) If two or more trades around a certain level are initiated based on false signals, subsequent signals from that level should be disregarded.
3) In a flat market, any currency pair can produce multiple false signals or none at all. In any case, the flat trend is not the best condition for trading.
4) Trading activities are confined between the onset of the European session and mid-way through the U.S. session, after which all open trades should be manually closed.
5) On the 30-minute timeframe, trades based on MACD signals are only advisable amidst substantial volatility and an established trend, confirmed either by a trendline or trend channel.
6) If two levels lie closely together (ranging from 5 to 15 pips apart), they should be considered as a support or resistance zone.
Support and Resistance price levels can serve as targets when buying or selling. You can place Take Profit levels near them.
Red lines represent channels or trend lines, depicting the current market trend and indicating the preferable trading direction.
The MACD(14,22,3) indicator, encompassing both the histogram and signal line, acts as an auxiliary tool and can also be used as a signal source.
Significant speeches and reports (always noted in the news calendar) can profoundly influence the price dynamics. Hence, trading during their release calls for heightened caution. It may be reasonable to exit the market to prevent abrupt price reversals against the prevailing trend.
Beginners should always remember that not every trade will yield profit. Establishing a clear strategy coupled with sound money management is the cornerstone of sustained trading success.
You have already liked this post today
*The market analysis posted here is meant to increase your awareness, but not to give instructions to make a trade.


