See also

 06.05.2024 01:55 PM
Trend-following analysis
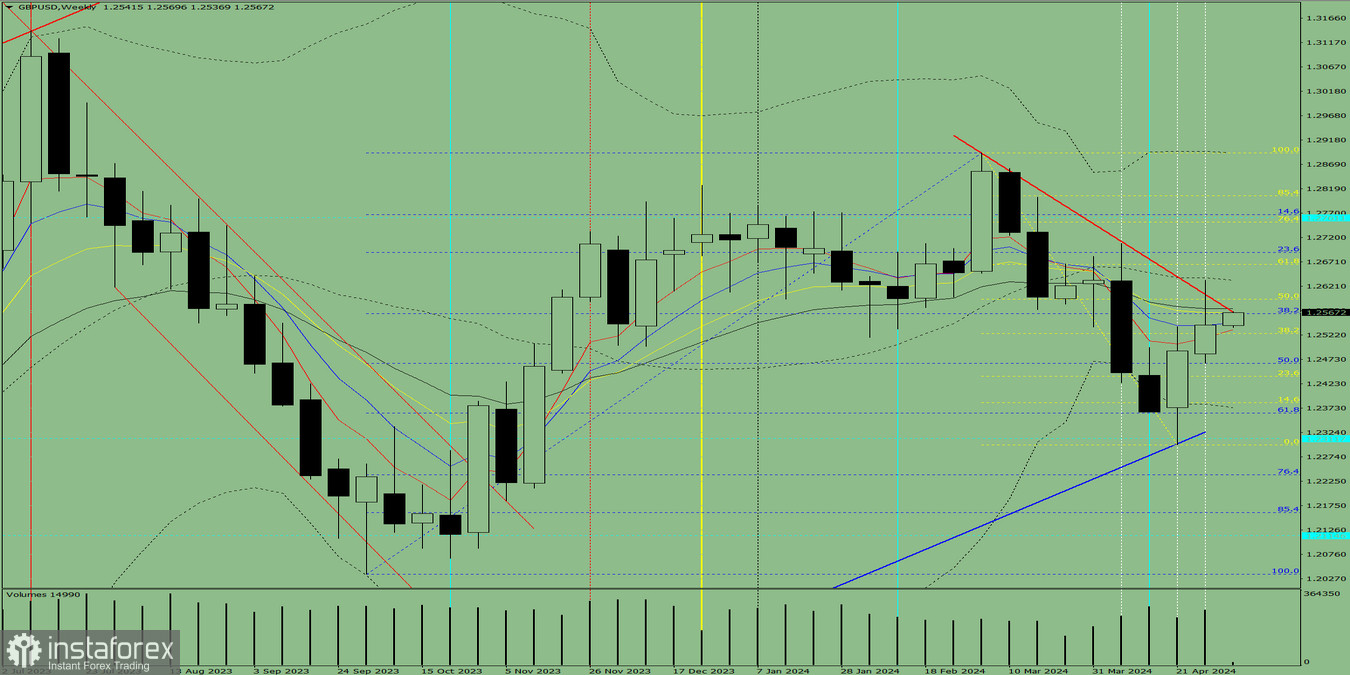
This week, from 1.2542, the closing level of the last weekly candle, GBP/USD may continue to move upward with a target of 1.2665, the retracement level of 61.8% plotted by the yellow dotted line. Once this level is reached, the price will most likely continue to move upward with a target of 1.2690, a retracement level of 23.6% plotted by the blue dotted line.
Complex analysis
Indicator analysis – up
Fibonacci levels – up
Trading volume – up
Candlestick analysis – up
Trend-following analysis – down
Bollinger bands – down
One-month chart – up
Conclusion of complex analysis: upward move
The result of evaluating the GBP/USD pair's candlestick on the weekly chart: this week, the instrument will most likely follow an uptrend, suggested by the absence of the first lower shadow of the weekly white candle (Monday - up) and the absence of the second upper shadow (Friday - up).
From 1.2542, the closing level of the last weekly candle, the price may continue to move upward with a target of 1.2665, the retracement level of 61.8% plotted by the yellow dotted line. After this level is reached, the instrument will most likely continue to move upward with a target of 1.2690, a retracement level of 23.6% plotted by the blue dotted line.
According to an alternative scenario, from 1.2542, the closing level of the last weekly candle, GBP/USD may begin to move upward with a target of 1.2665, the retracement level of 61.8% plotted by the yellow dotted line. Once this level is reached, the price may pull back down with a target of 1.2594, the 50% retracement level represented by the yellow dotted line.
You have already liked this post today
*The market analysis posted here is meant to increase your awareness, but not to give instructions to make a trade.


