See also

 04.08.2025 10:38 AM
This week, from the 1.1586 level (closing price of the latest weekly candle), the market may begin an upward move targeting 1.1829 – the upper fractal (weekly candle from June 29, 2025). Upon testing this level, the price may begin to move downward toward 1.1717 – the 14.6% retracement level (blue dotted line).
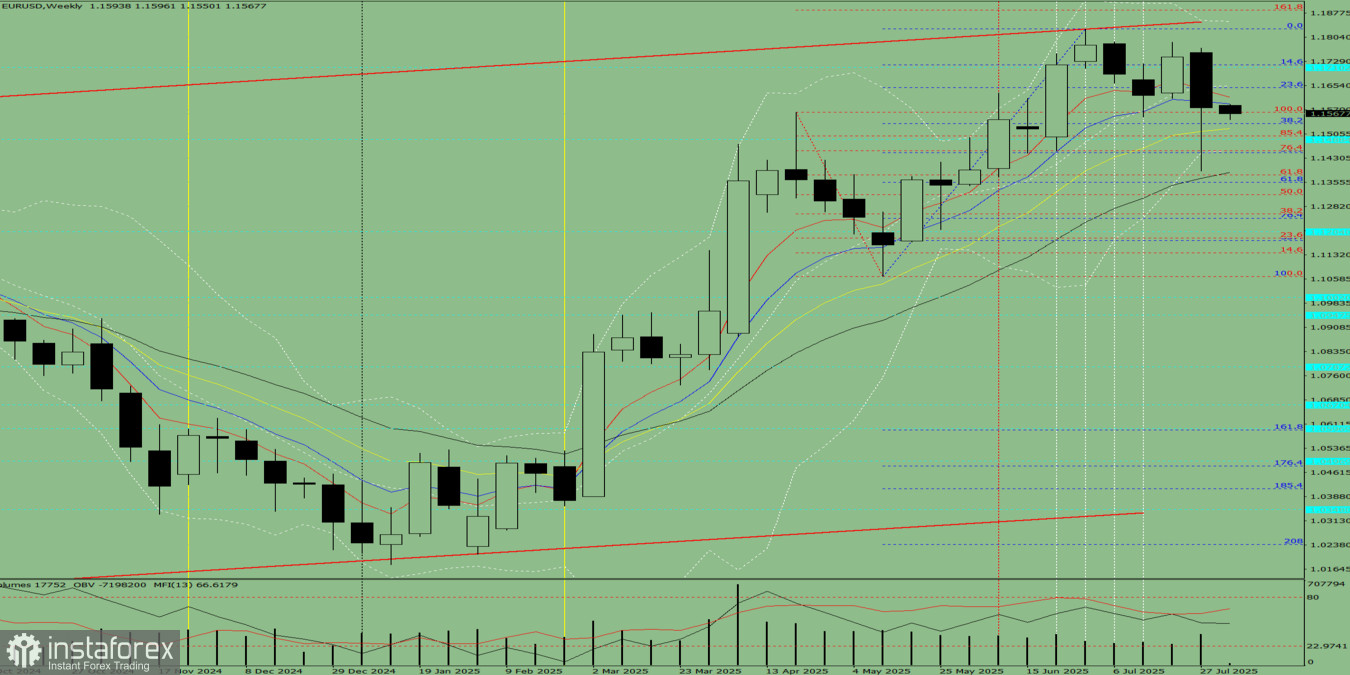
Fig. 1 (Weekly Chart)
Conclusion based on comprehensive analysis: Upward trend.
General forecast based on the EUR/USD weekly chart: The price is most likely to follow an upward trend this week, forming a white weekly candle with a lower shadow on Monday (downward movement), followed by an upper shadow on Friday (downward correction).
From the 1.1586 level (closing price of the latest weekly candle), the pair may begin an upward movement toward 1.1717 – the 14.6% retracement level (blue dotted line). Upon testing this level, the price may pull back downward toward 1.1647 – the 23.6% retracement level (blue dotted line).
You have already liked this post today
*The market analysis posted here is meant to increase your awareness, but not to give instructions to make a trade.


