
See also


 28.05.2026 03:44 AM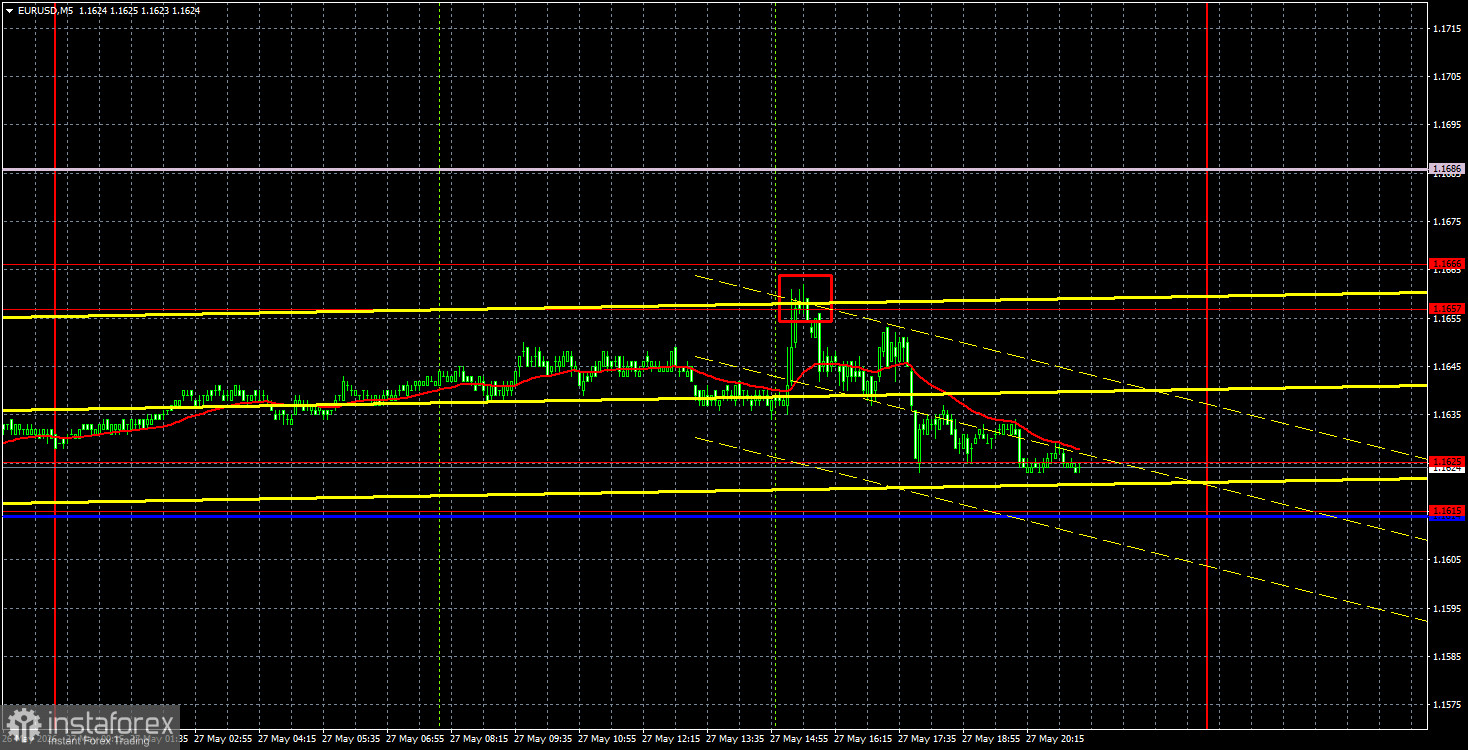
The EUR/USD currency pair began the new week with a fairly strong upward surge, but the market then calmed and has been trading within a sideways channel for three consecutive days, limited by two areas: 1.1615-1.1625 and 1.1657-1.1666. Thus, we can speak of a flat formation. What is causing this flat? The macroeconomic backdrop is absent this week, and the fundamental backdrop is lacking. There is an abundance of geopolitical news every day, often contradictory. As a result, the market is not rushing to react to another geopolitical news item, understanding that it is highly likely to prove false. Therefore, there has simply been nothing for the market to react to this week. The ceasefire, negotiations, and the potential deal between the U.S. and Iran remain in limbo, and the market does not fully understand the chances of a positive outcome.
From a technical standpoint, the downward trend persists. The price is below the Senkou Span B line, and a trendline is still not possible to establish. Thus, we will only consider the downward trend complete after the Senkou Span B line is overcome. Without the signing of a memorandum between Tehran and Washington, it will be difficult for the euro to rise above this line.
On the 5-minute timeframe, a first sell signal was generated during the American trading session, when the price bounced from the 1.1657-1.1666 area. Within a couple of hours, the price reached the 1.1615-1.1625 area. Additionally, a buy signal was generated on Tuesday following a bounce from the 1.1615-1.1625 area, which also yielded profits for traders. Despite the flat movement, two trades could be opened, both of which would be profitable.
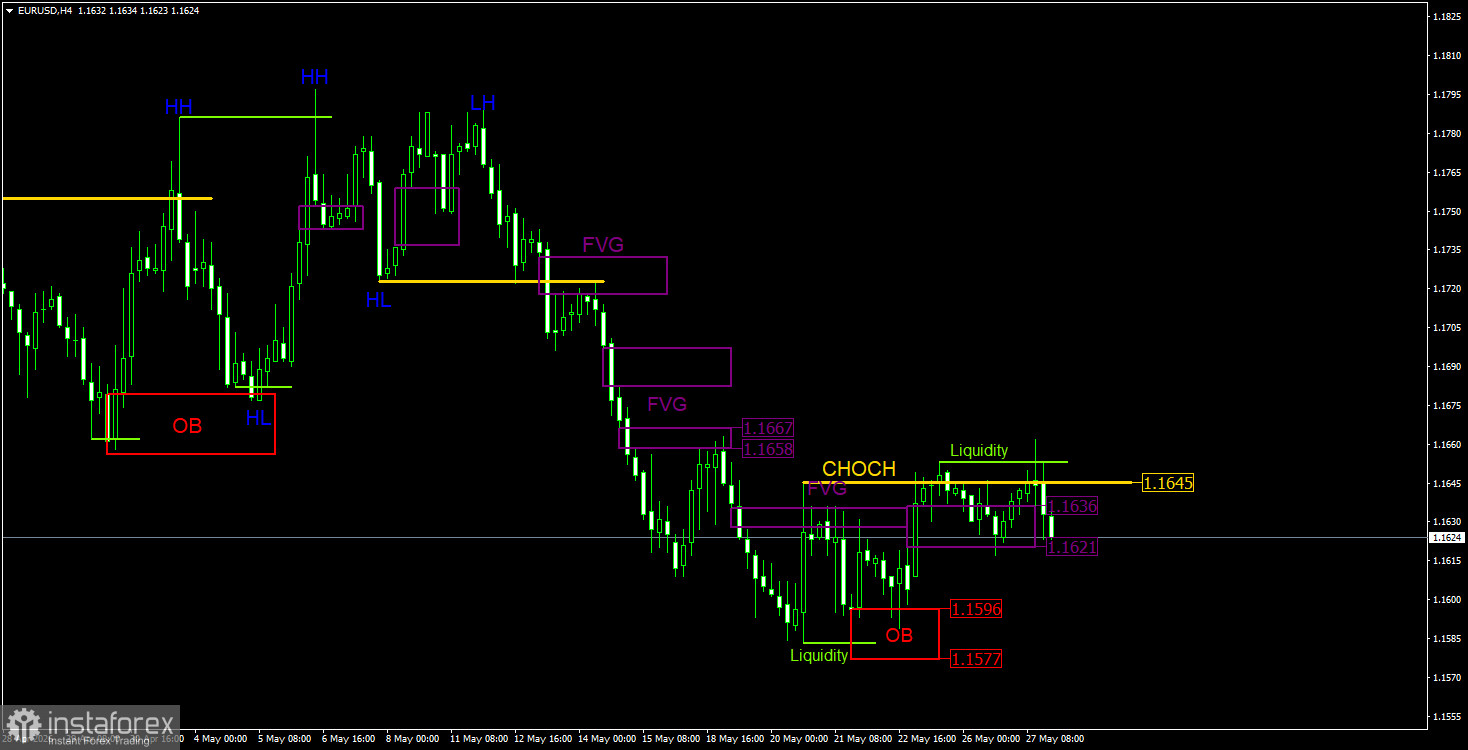
On the 4-hour timeframe within the ICT trading system, the price generated a buy signal in a "bullish" order block last week, and on Monday, a new bullish FVG formed and received a response. However, on Tuesday, the geopolitical situation sharply worsened again, and the signing of the memorandum that Trump has been discussing every hour and a half is once again on the brink of collapse. Therefore, further growth of the euro did not occur. Currently, there are no new patterns, and the CHOCH line has not been surpassed to break the downward trend.
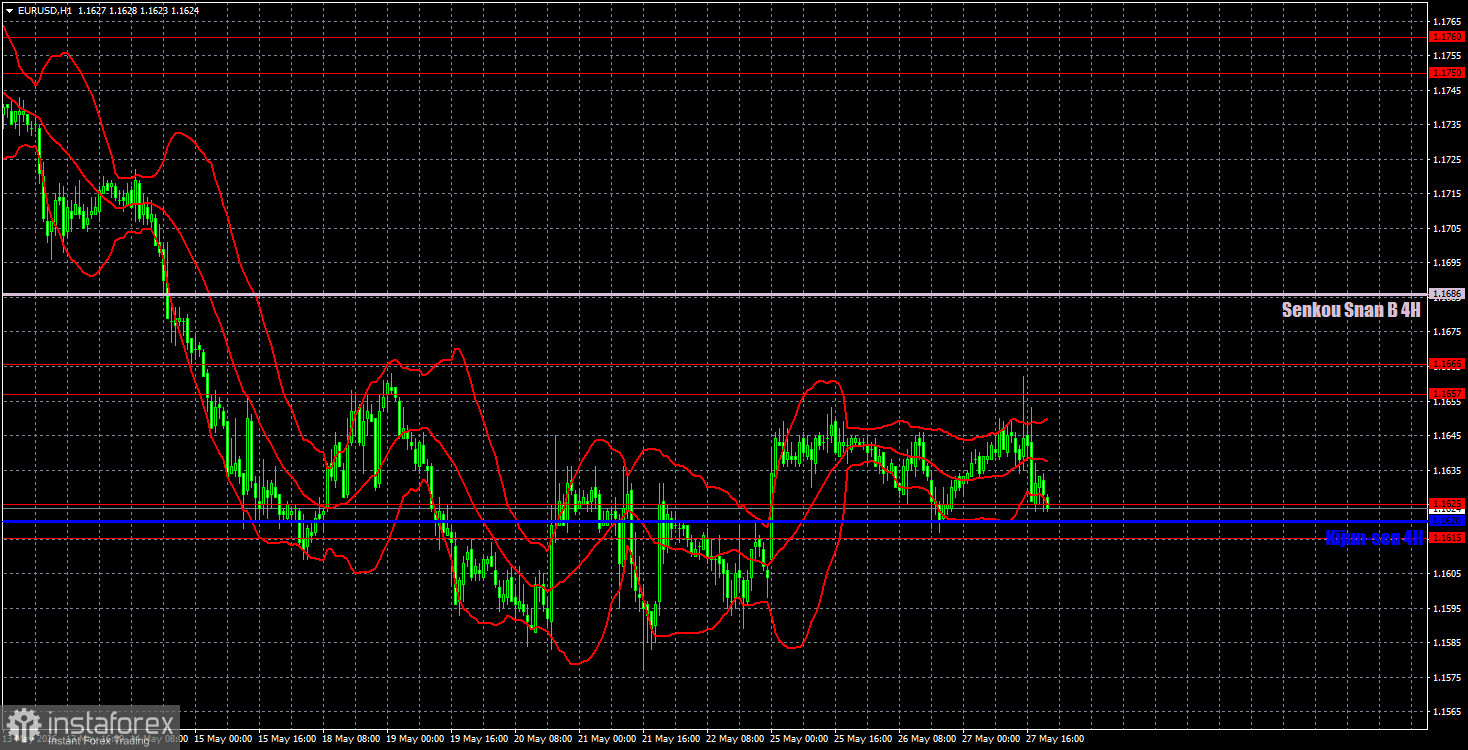
On the hourly timeframe, the EUR/USD pair continues to form a downward trend. The situation in the Middle East remains tense but has not worsened, and Washington and Tehran may, in theory, sign a preliminary agreement. If no new signs of escalation emerge in the Middle East and the memorandum is indeed signed, the dollar will begin to lose ground. However, we are currently observing the opposite situation.
For May 28, we highlight the following levels for trading: 1.1362, 1.1426, 1.1542, 1.1615-1.1625, 1.1657-1.1666, 1.1750-1.1760, 1.1786, 1.1830-1.1837, 1.1907-1.1922, as well as the Senkou Span B line (1.1686) and Kijun-sen (1.1620). The lines of the Ichimoku indicator may shift throughout the day, which should be taken into account when determining trading signals. Don't forget to set your stop-loss orders to breakeven if the price moves in the correct direction by 15 pips. This will protect against potential losses if the signal turns out to be false.
On Thursday, Christine Lagarde will speak in the Eurozone—this will be the first interesting event of the week. In the U.S., reports on durable goods orders and core personal consumption expenditures (PCE) will be published. We cannot say that these are highly important reports. Most likely, they will not lead to a conclusion of the sideways movement.
Today, traders may open short positions targeting 1.1542 if the price consolidates below the 1.1615-1.1625 area. Long positions can be opened if the price bounces from the 1.1615-1.1625 area, targeting the 1.1657-1.1666 area and the Senkou Span B line. On the 4-hour timeframe, there are no relevant patterns, and the current situation on the hourly timeframe is flat.


