
See also


 21.09.2026 12:02 PM
The upward wave algorithm that started on June 24 continues to move the euro pair's quotes toward the upper part of the chart. Since the end of August, the price has been moving sideways, forming a corrective part (B), which had not been completed at the time of analysis. A week ago, the price entered the boundaries of a strong potential reversal zone, forming the final part (C) of the correction.
Over the next couple of days, a sideways direction can be expected, with the euro declining toward the calculated support levels. Closer to the weekend, a reversal is expected to form in this zone, followed by a resumption of the upward direction. The calculated support/resistance zones indicate the expected weekly trading range of the pair.
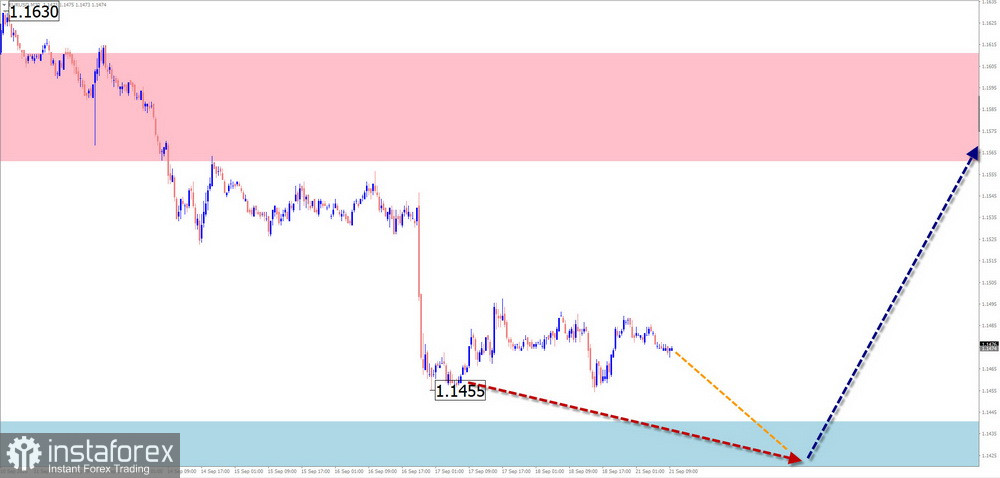
Resistance:
Support:
Sales: May be used during individual sessions with a reduced position size. The potential is limited by the reversal zone.
Purchases: It is premature to consider buying until reversal signals appear near the support zone.
On the Japanese yen chart, a bullish wave structure with a high wave degree has been forming since the beginning of August following the completion of a hidden correction. Within its structure, the final part (C) is currently nearing completion in a sideways range. The price has formed a horizontal corridor approximately a couple of price figures wide.
Over the coming days, the most likely scenario is a continuation of sideways movement along the boundaries of the calculated support. Pressure on its lower boundary cannot be ruled out, potentially resulting in a brief break below it. Closer to the weekend, increased volatility and a resumption of the pair's upward movement can be expected. The release of important economic news may serve as a timing reference.
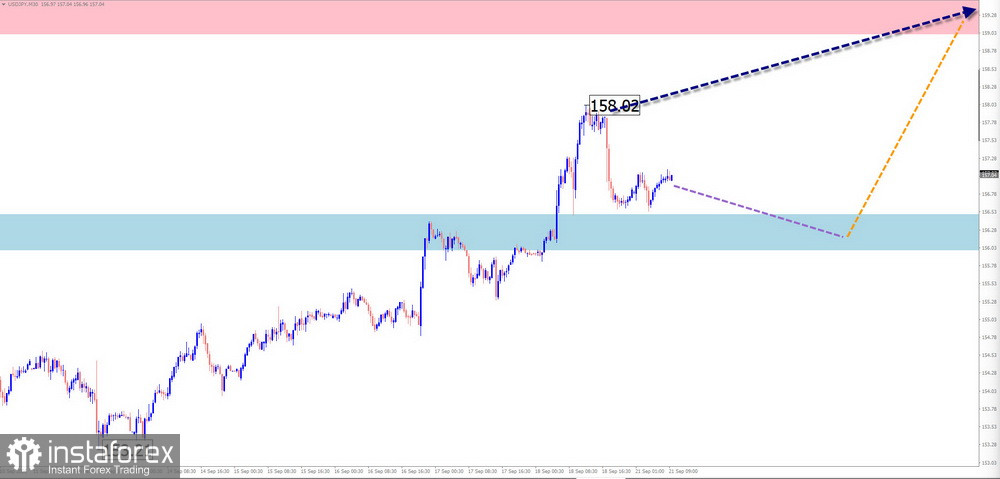
Resistance:
Support:
Sales: Due to their limited potential, they carry high risk and may result in losses.
Purchases: After reversal signals appear near the support zone on the technical systems you use, buying may become the main direction for trading.
On the pound/yen pair chart, the upward wave that started in August continues to develop in the form of a running flat. The quotes have reached the lower boundary of a broad potential reversal zone on a higher timeframe. The final part of the wave started moving upward on September 8. At the time of analysis, the structure of this section of the chart does not indicate completion.
In the coming days, predominantly sideways price movement is expected on the pair's chart. During the first few days, a sideways range with a downward direction is possible along the boundaries of the support zone. In the second half of the week, the sideways period is expected to end and the upward movement to resume. Increased volatility may coincide with the release of important economic data.
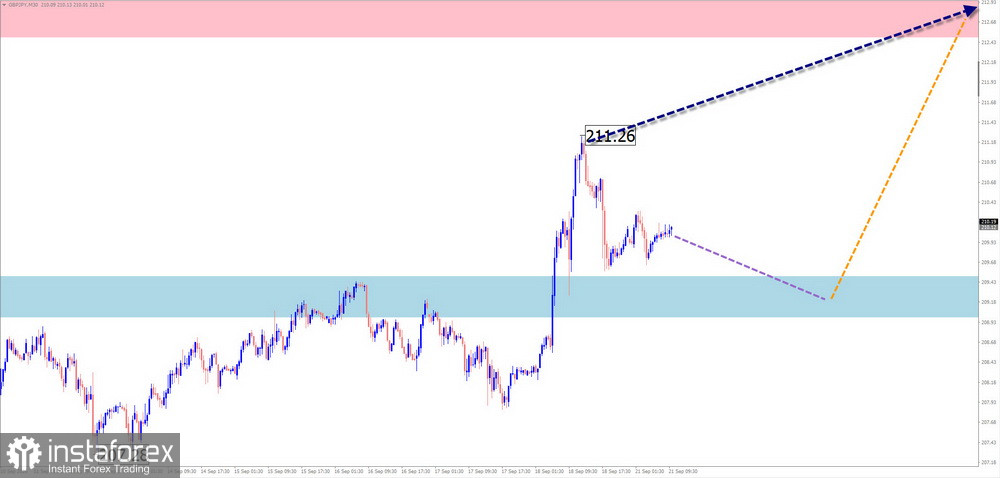
Resistance:
Support:
Sales: Have limited potential and carry a high degree of risk.
Purchases: May be used for trades after confirmed reversal signals appear near the support zone.
The trend direction of the Canadian dollar major pair is determined by the algorithm of a downward wave that started at the beginning of the year. Since the end of August, the quotes have moved sideways, beginning to form a correction. On the chart, the price extremes are forming a running flat. Its structure does not appear to be complete. The wave is in its final formation phase.
Over the coming days, there is a high probability of sideways movement with a downward direction. The price is likely to move no further than the support boundaries. Subsequently, a reversal can be expected to form, followed by a resumption of the upward movement. The calculated resistance indicates the upper boundary of the expected weekly trading range of the pair.
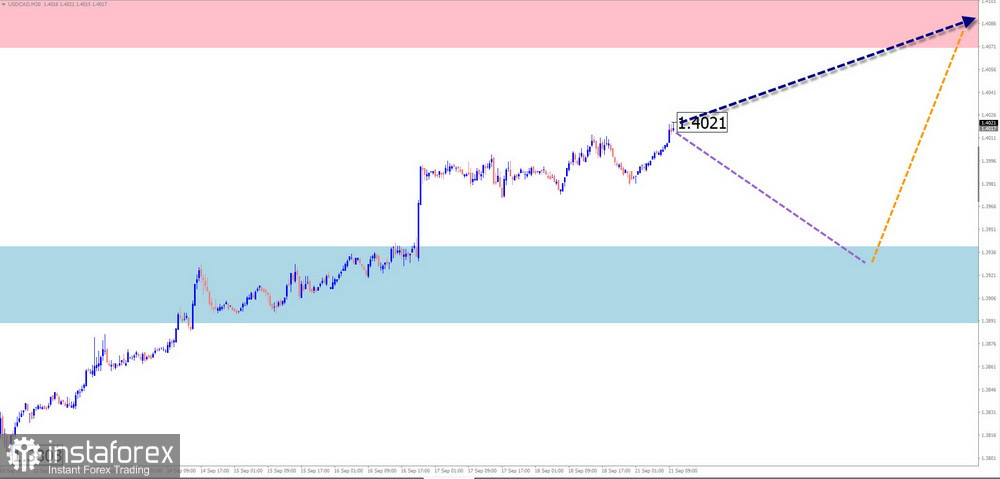
Resistance:
Support:
Sales: May be considered using a fractional position size, but have limited potential.
Purchases: Will become profitable after confirmed signals from your technical systems appear near the support zone. The limited upward potential should be taken into account when entering trades.
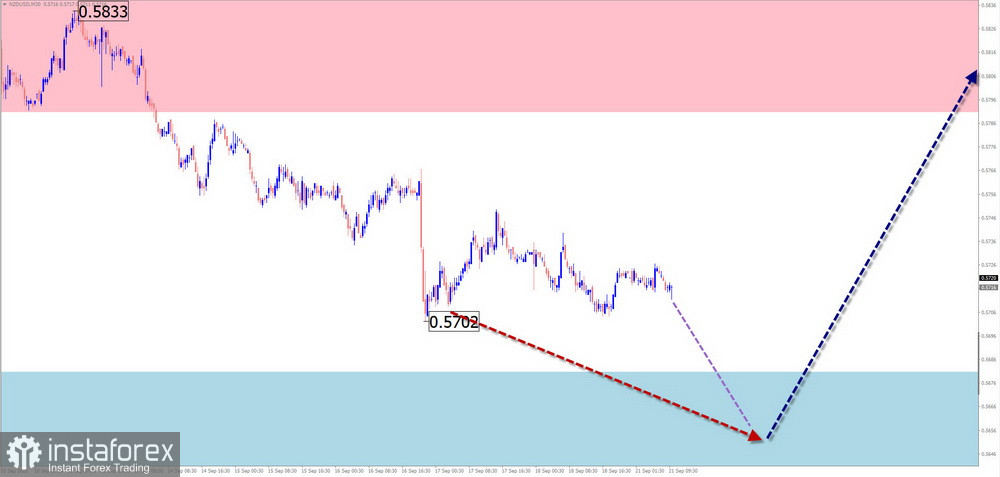
The current wave structure on the chart is upward and dates back to June of this year. Since the end of August, a corrective flat has been developing within the wave and had not been completed at the time of analysis. The preliminary target zone for the entire correction coincides with the upper boundary of a strong potential reversal zone on a higher timeframe.
Over the coming days, there is a high probability of sideways movement with a downward direction. The price is expected to move no further than the support boundaries. By the end of the week, a reversal can be expected to form, followed by a resumption of the bullish movement. The calculated resistance indicates the expected upper boundary of the pair's weekly trading range.
Resistance:
Support:
Sales: May be considered with a fractional position size during individual sessions. They have limited potential.
Purchases: Are not advisable until confirmed reversal signals appear on your technical systems near the support zone.
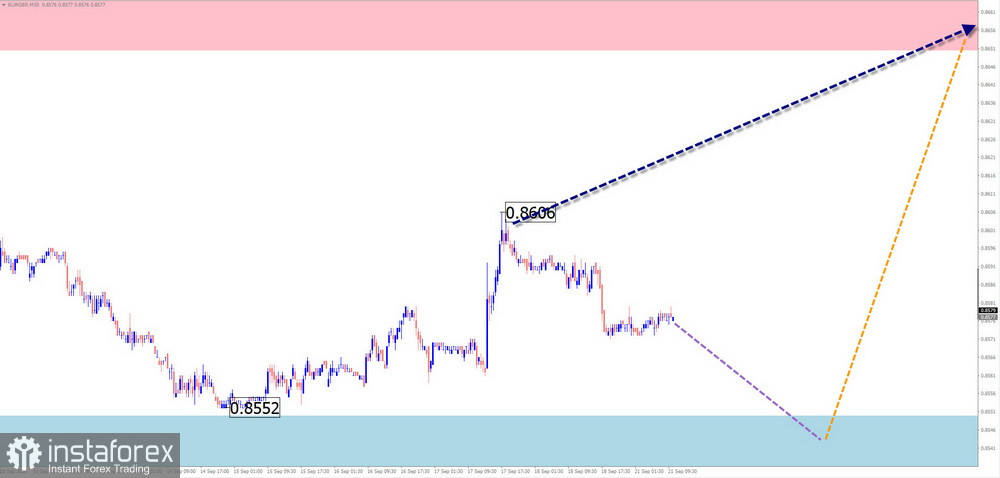
The direction of price fluctuations in the euro/British pound cross has been determined by a downward wave since November last year. A correction in the form of a running flat has been developing since mid-July. At the time of analysis, an incomplete section of movement (B) is forming within it. Over the past two months, the price has been moving along the upper boundary of a broad potential reversal zone on the daily timeframe.
At the beginning of the upcoming weekly period, sideways movement can be expected. A short-term decline toward the boundaries of the support zone is possible. Closer to the weekend, the probability of a reversal and a resumption of upward price movement increases. A move beyond the boundaries of the calculated zones is unlikely.
Resistance:
Support:
Sales: May be considered for short-term trades during individual sessions.
Purchases: May be used for trading after appropriate signals appear near the calculated resistance.
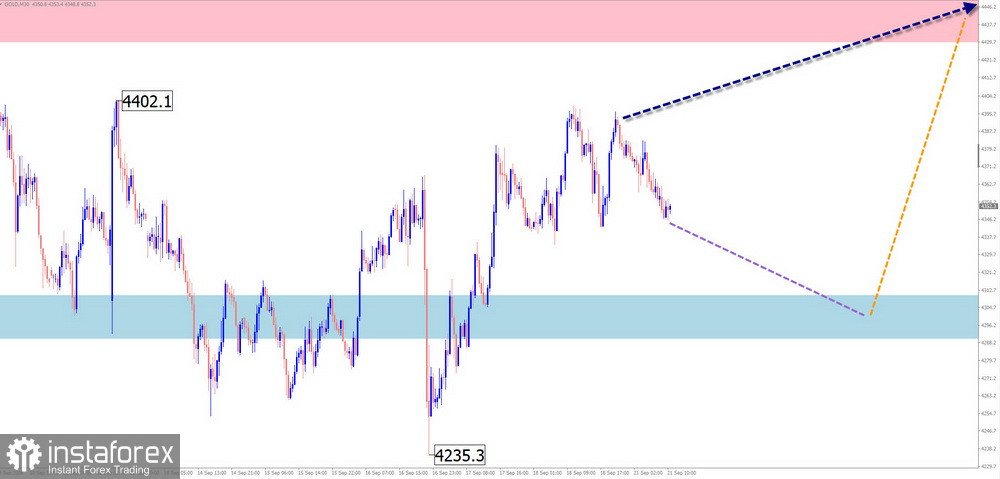
On the gold chart, the downward wave that started in August of this year continues to develop. On the daily timeframe, it forms a corrective section of the trend. The wave structure is developing in the form of an expanded flat.
At the beginning of the upcoming week, a short-term decline toward the support zone levels can be expected. Subsequently, a transition to a sideways phase is expected, with conditions forming for a reversal and a price increase toward the resistance zone.
Resistance:
Support:
Sales: Have limited potential and carry high risk.
Purchases: Will become relevant for trading after appropriate confirmed reversal signals appear near the support zone.
In simplified wave analysis (SWA), all waves consist of three parts (A-B-C). On each timeframe, the latest incomplete wave is analyzed. Expected movements are shown with a dashed line.
Attention: The wave algorithm does not take into account the duration of an instrument's movements over time.


